INFOGRAPHICS: September 2018 REBGV Greater Vancouver Market Reports

As we welcome the final quarter of the year, here are the latest market trends in areas covered by the Real Estate Board of Greater Vancouver (REBGV).
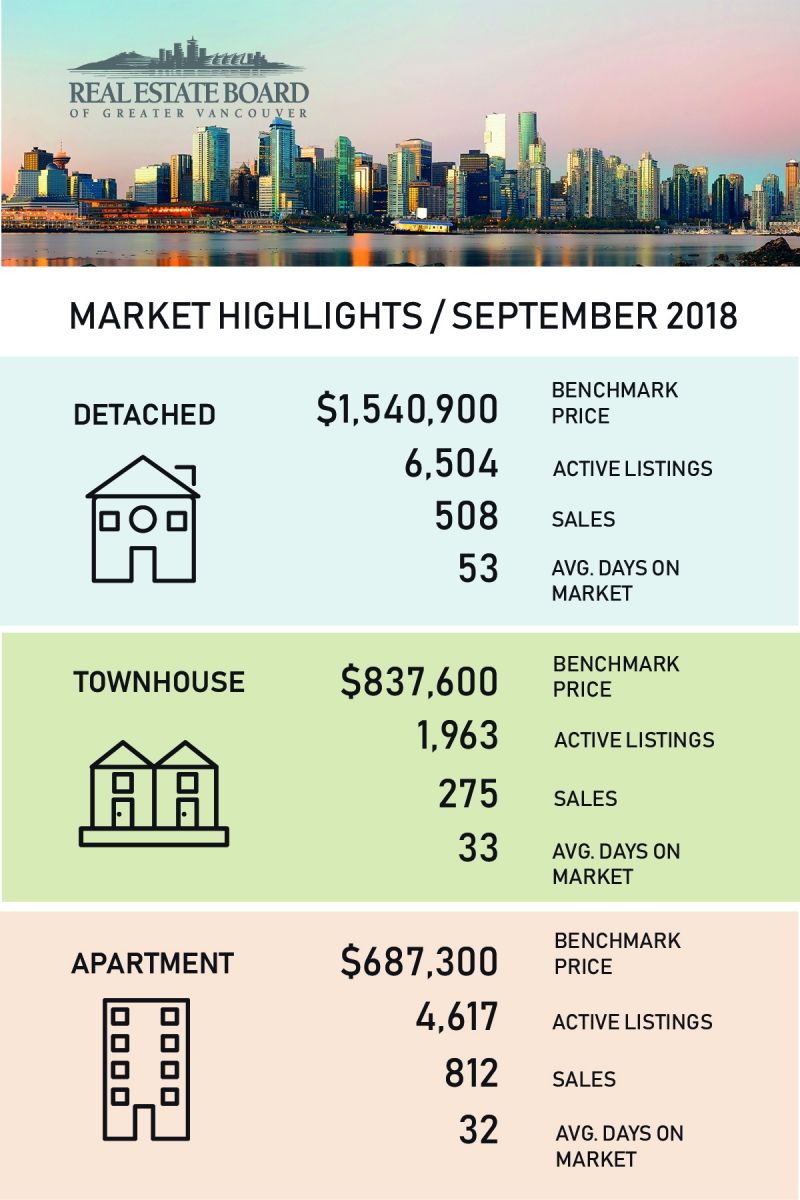
According to REBGV’s latest press release, September 2018 saw more supply and less demand across the Metro Vancouver housing market. It states that “the supply of homes for sale continued to increase… while home buyer demand remained below typical levels for this time of year.”
In fact, last month’s sales are reported to be 36.1% below the 10-year September sales average.
According to REBGV president-elect Ashley Smith:
“Fewer home sales are allowing listings to accumulate and prices to ease across the Metro Vancouver housing market. There’s more selection for home buyers to choose from today. Since spring, home listing totals have risen to levels we haven’t seen in our market in four years.”
As always, the REBGV stresses the importance of buyers working with their realtors in order for them to understand these current trends, and how it will be impacting them.
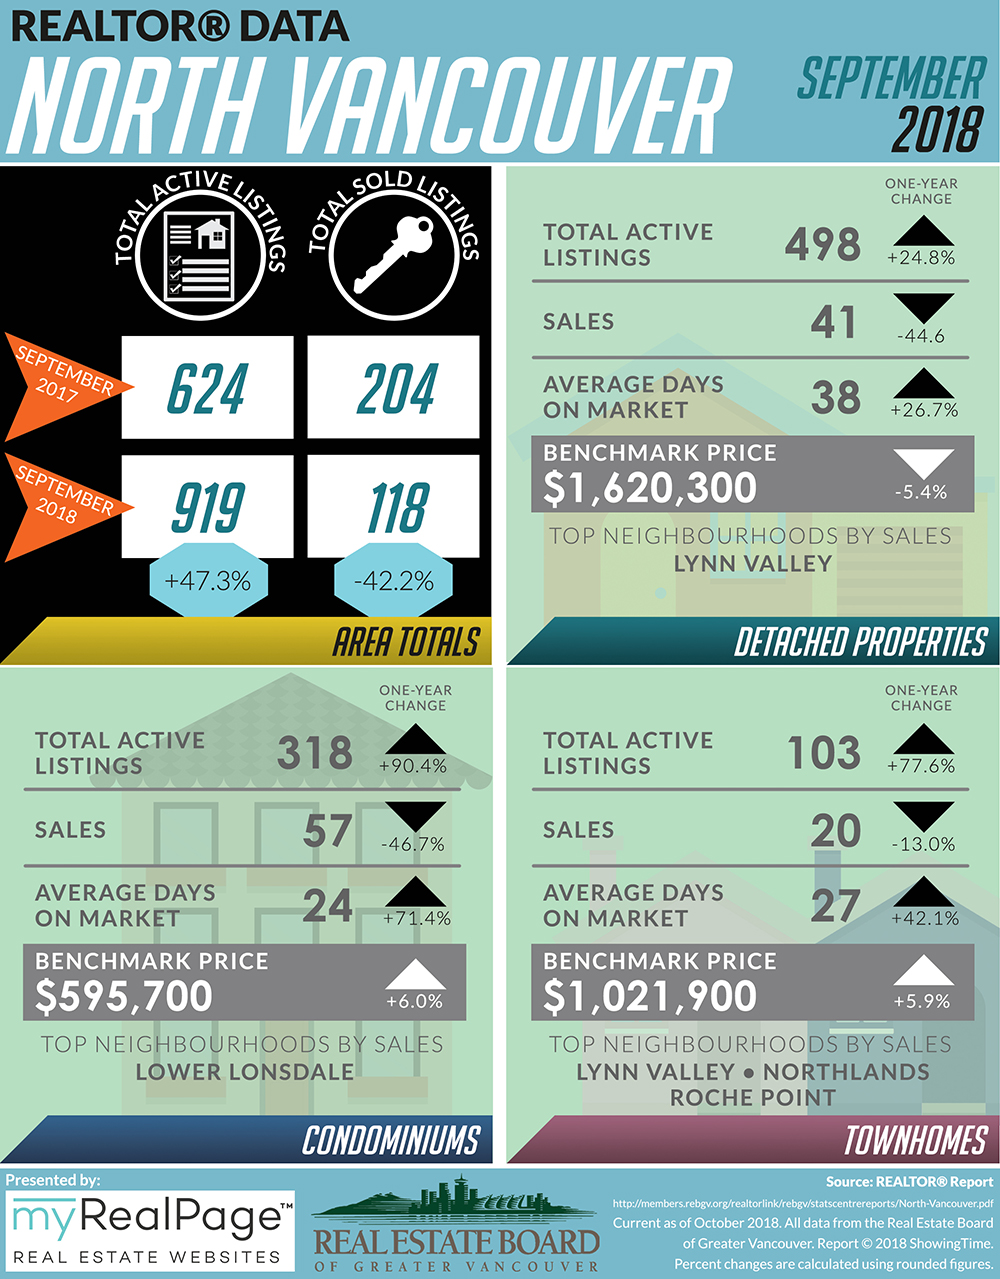
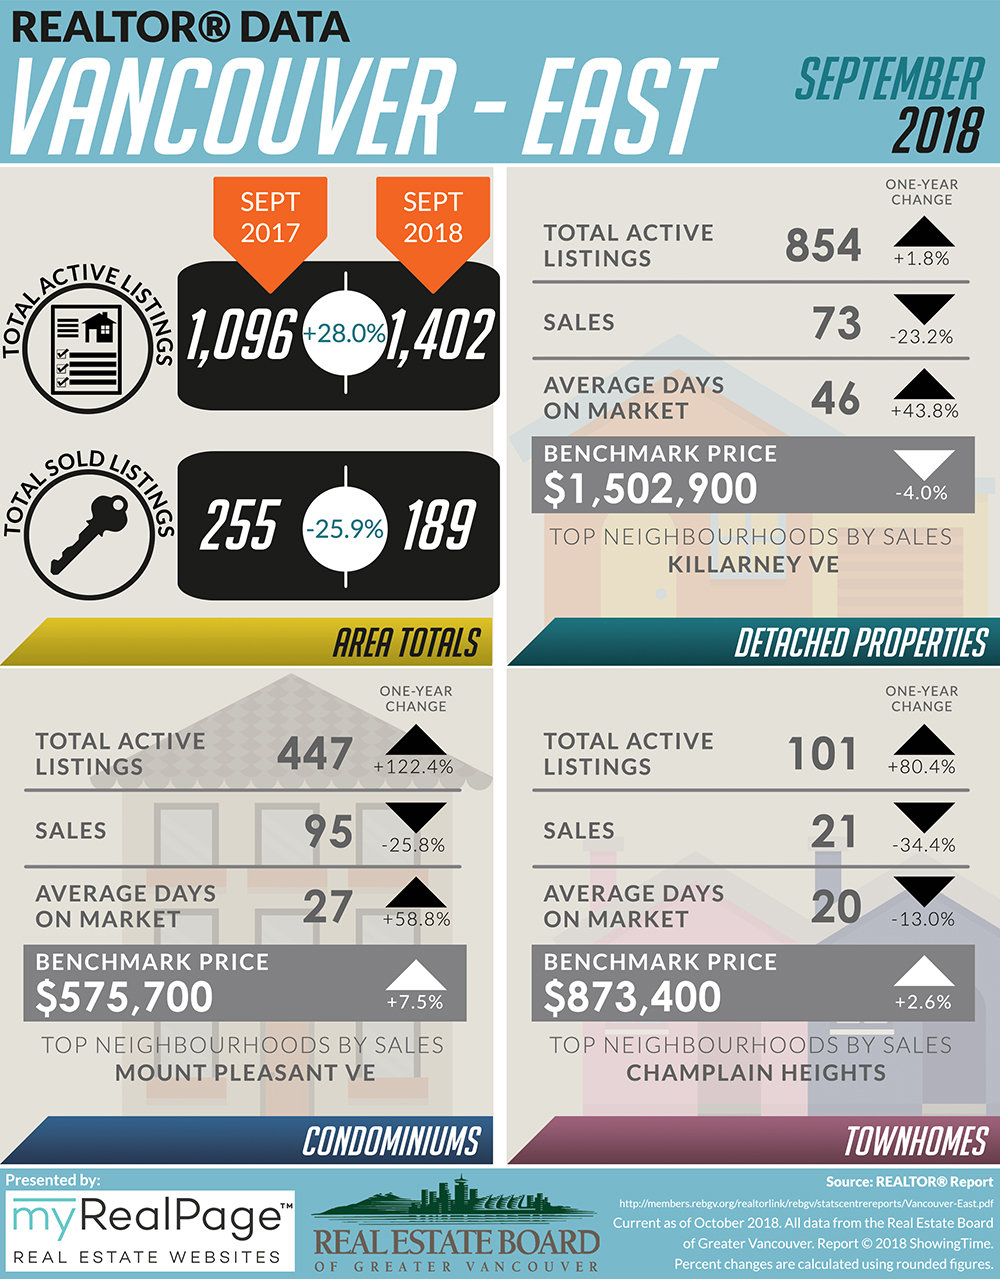
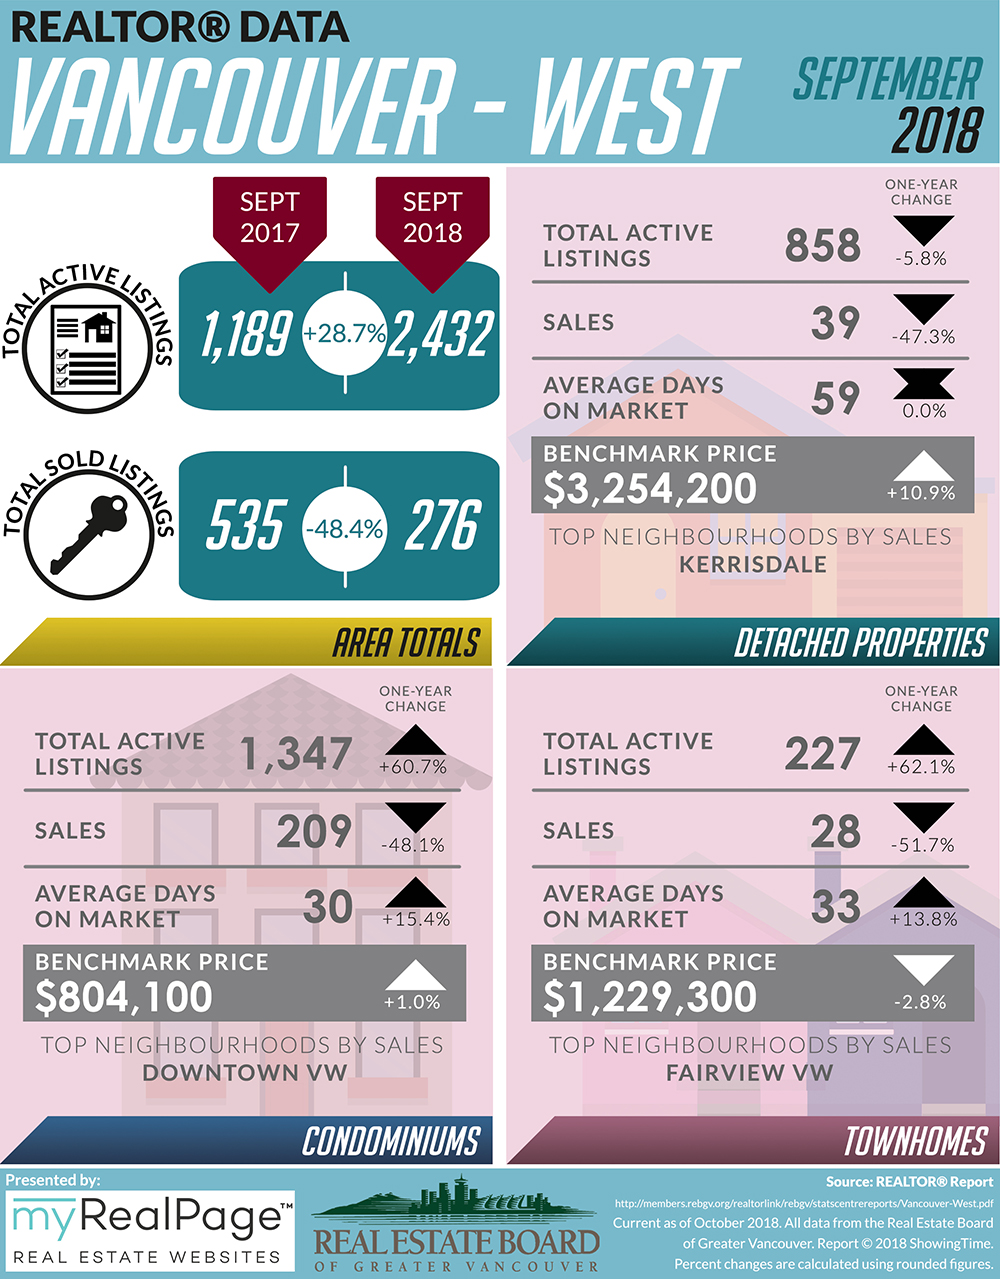
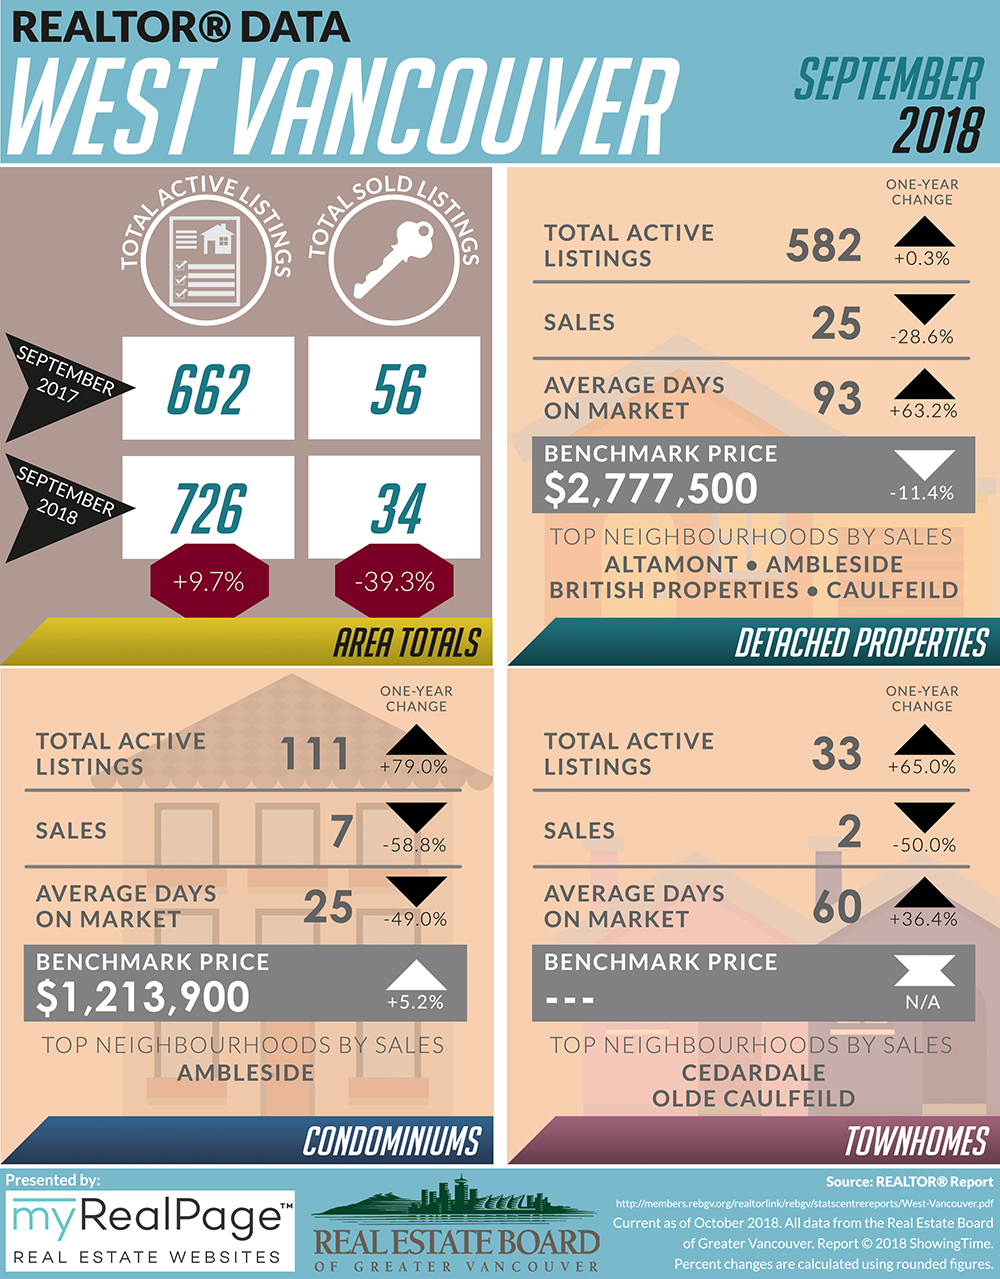
The following data is a comparison between September 2017 and September 2018 numbers, and is current as of October 2018. For last month’s update, you can check out our previous post for August 2018 data. Or follow this link for all our REBGV Infographics!
These infographics cover current trends in North Vancouver, West Vancouver, Vancouver East, and Vancouver West.
Click on the images for a larger view!
(Protip: Make sure to grab the printable PDF versions, too! It fits best when printed on A4-sized sheets, AND we’ve added an area on the sheet where you can attach your business card! 🙂 )
Download Printable Version – REBGV September 2018 Data Infographics
(Image Source: https://www.rebgv.org/ )
Last Updated on July 25, 2022 by myRealPage
