INFOGRAPHICS: December 2019 REBGV Greater Vancouver Market Reports

Happy New Year!
It’s the dawn of a new year, and a new decade, and we’re ready to hit the ground running. Here’s our monthly market update for areas covered by the Real Estate Board of Greater Vancouver (REBGV)!
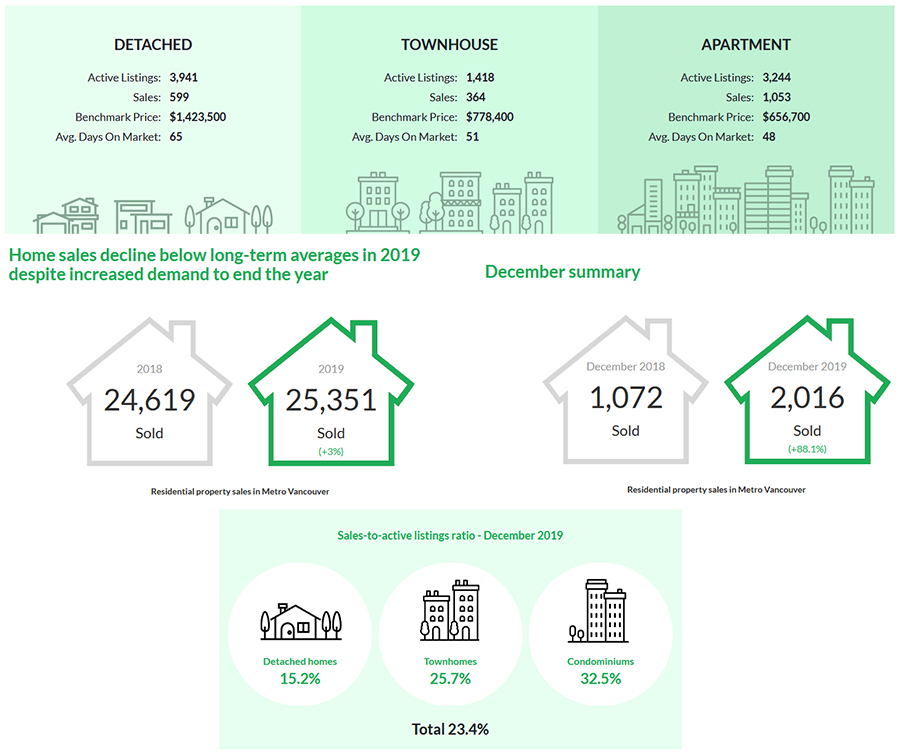
According to REBGV’s latest market update, sales of detached, attached and apartment homes reached 25,351 in 2019, a 3% increase from the 24,619 sales recorded in 2018, and a 29.6% decrease over the 35,993 residential sales in 2017.
Last year’s sales total was 20.3% below the region’s 10-year sales average.
Home listings on the Multiple Listing Service® (MLS®) in Metro Vancouver reached 51,918 in 2019. This is a 3.2% decrease compared to the 53,614 homes listed in 2018 and a 5% decrease compared to the 54,655 homes listed in 2017.
Last year’s listings total was 7.6% below the 10-year average.
 As noted by Ashley Smith, REBGV president,
“We didn’t see typical seasonal patterns in 2019. Home buyer demand was quieter in the normally busy spring season and it picked up in the second half of the year. In terms of home values, prices dipped between 2% and 4% across the region last year depending on property type.
Home buyer confidence was a factor throughout the year. In the first quarter, many prospective buyers were in a holding pattern, waiting to see how prices would react to the mortgage stress test, new taxes, and other policy changes. Confidence started to return in the summer, and we saw above average sales in the final quarter of 2019.”
REBGV reports that residential home sales in the region totalled 2,016 in December 2019, an 88.1% increase from the 1,072 sales recorded in December 2018, and a 19.3% decrease from the 2,498 homes sold in November 2019.
Last month’s sales were 9.5% above the 10-year December sales average.
There were 1,588 detached, attached and apartment properties newly listed for sale on the MLS® in Metro Vancouver in December 2019. This represents a 12.9% increase compared to the 1,407 homes listed in December 2018 and a 46.8% decrease compared to November 2019 when 2,987 homes were listed.
The total number of homes currently listed for sale on the MLS® system in Metro Vancouver is 8,603, a 16.3% decrease compared to December 2018 (10,275) and a 20.1% decrease compared to November 2019 (10,770).
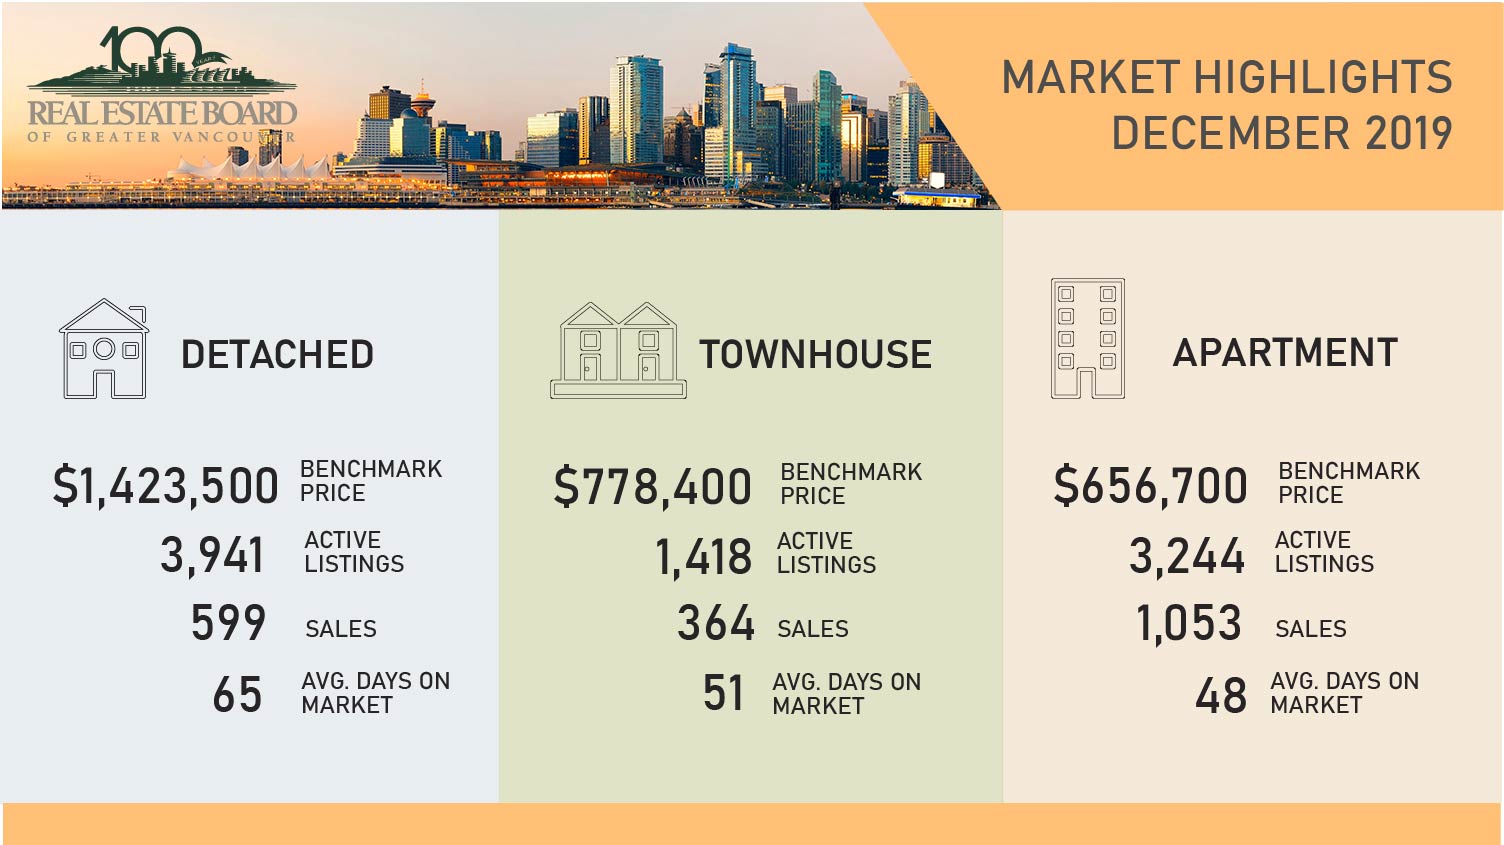
For all property types, the sales-to-active listings ratio for December 2019 is 23.4%. By property type, the ratio is 15.2% for detached homes, 25.7% for townhomes, and 32.5% for apartments.
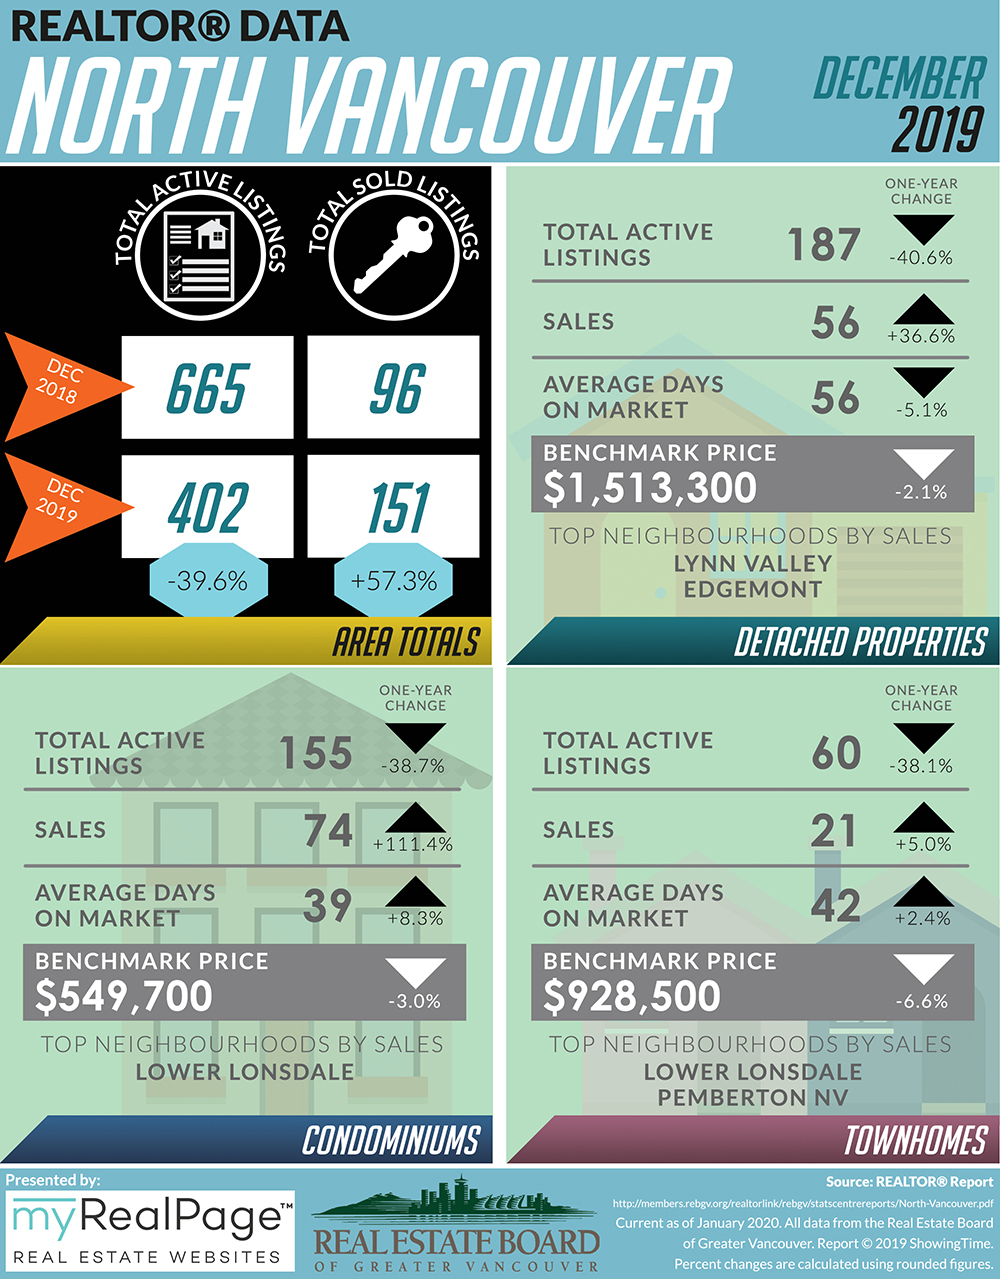
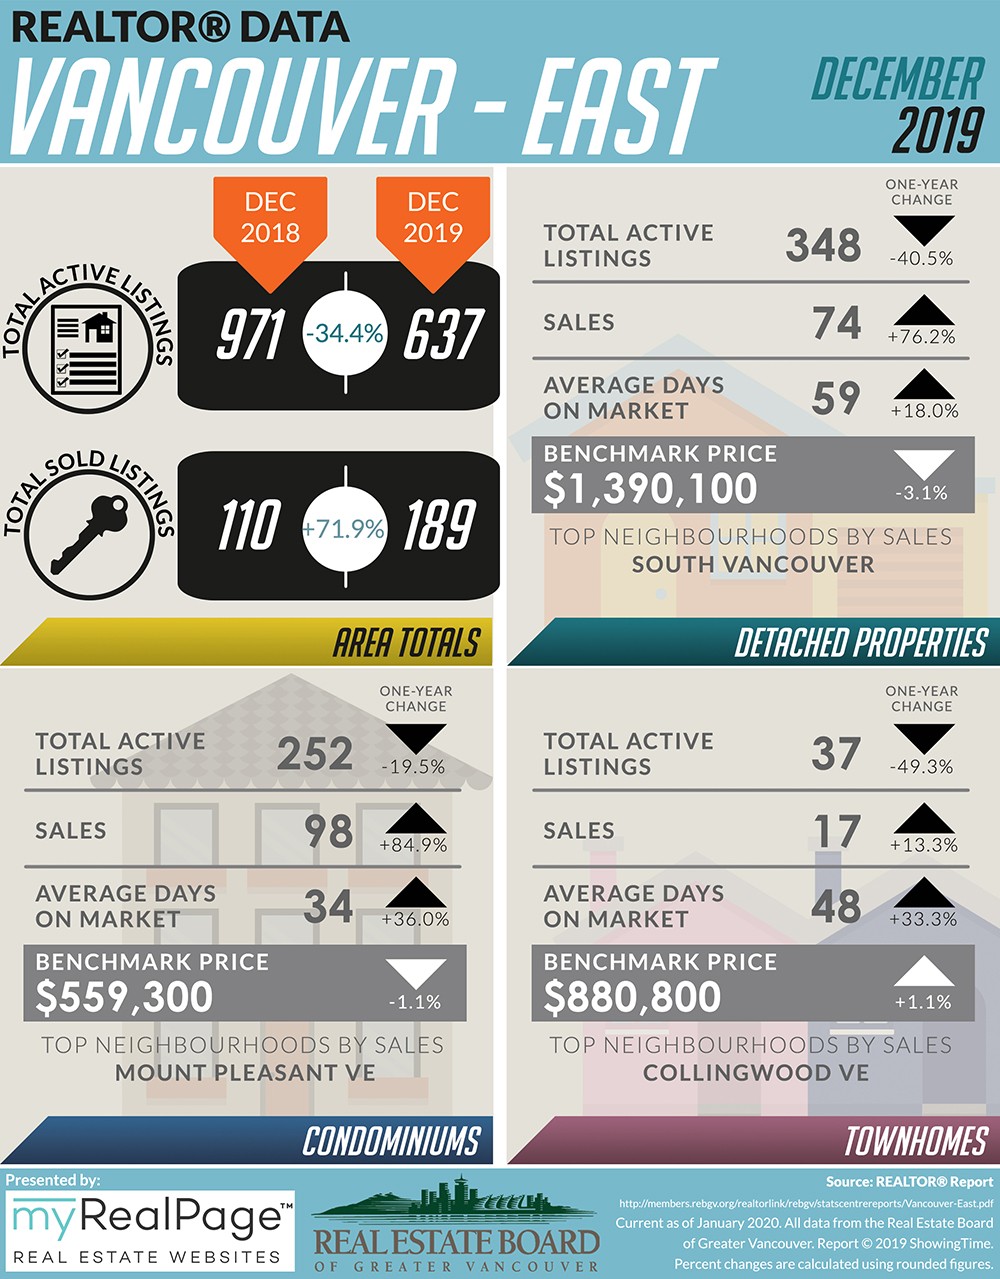
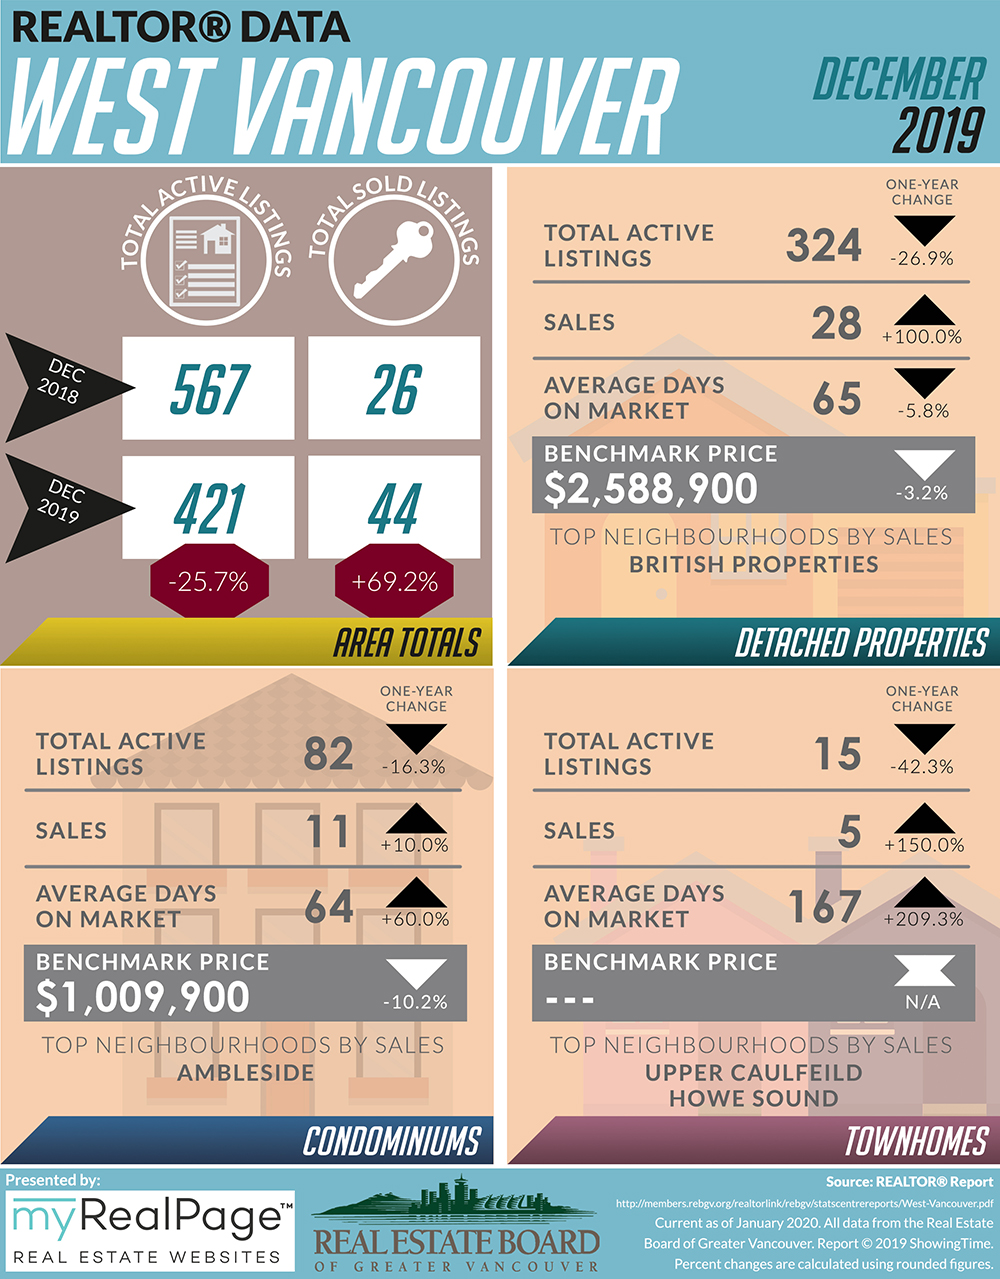
The following data is a comparison between December 2018 and December 2019 numbers, and is current as of January 2020. For last month’s update, you can check out our previous post for November 2019 data.
Or follow this link for all our REBGV Infographics!
These infographics cover current trends in North Vancouver, West Vancouver, Vancouver East, and Vancouver West.
Click on the images for a larger view!
(Protip: Make sure to grab the printable PDF versions, too! It fits best when printed on A4-sized sheets, AND we’ve added an area on the sheet where you can attach your business card! 🙂 )
Download Printable Version – REBGV December 2019 Data Infographics

(Image Source: REBGV Twitter)
(Image Source: REBGV.org)
Last Updated on July 25, 2022 by myRealPage
