INFOGRAPHICS: December 2019 TREB Toronto Market Reports

2020 is finally here! And here are the latest real estate market updates for areas covered by the Toronto Real Estate Board (TREB)!
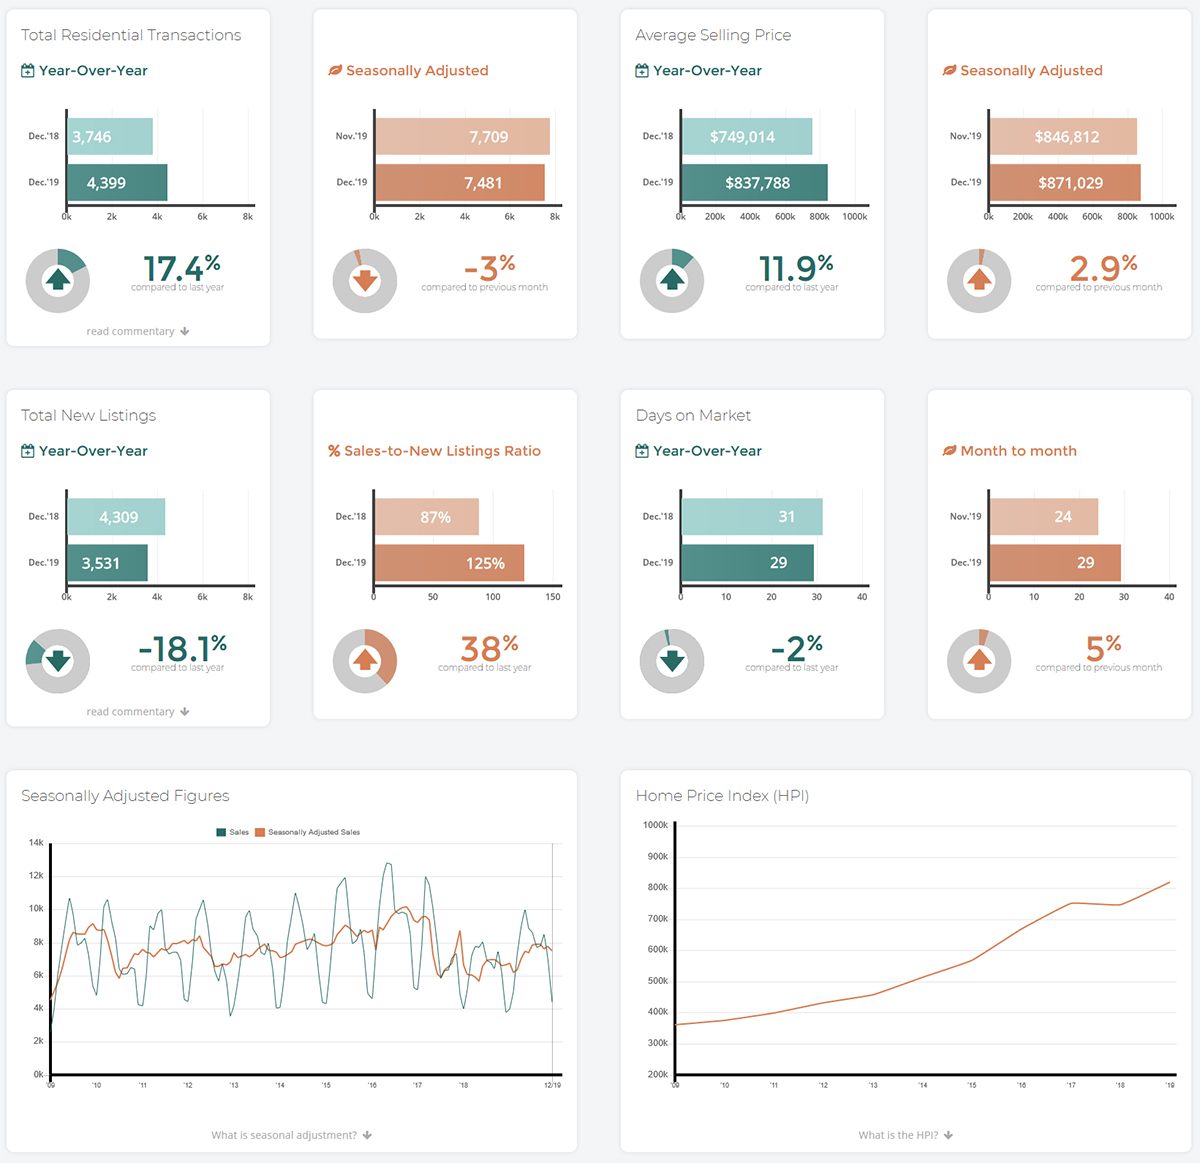
As per TREB’s latest market report, December 2019 residential sales reported through TREB’s MLS® System by Greater Toronto Area REALTORS® were up by 17.4% year-over-year to 4,399. Total sales for calendar year 2019 amounted to 87,825 – up by 12.6% compared to the decade low 78,015 sales reported in 2018. On an annual basis, 2019 sales were in line with the median annual sales result for the past decade.
While sales were up in 2019, the number of new listings entered into TREB’s MLS® System was down by 2.4% year-over-year. For the past decade, annual new listings have been largely in a holding pattern between 150,000 and 160,000, despite the upward trend in home prices over the same period.
As noted by Toronto Real Estate Board President Michael Collins,
“We certainly saw a recovery in sales activity in 2019, particularly in the second half of the year. As anticipated, many home buyers who were initially on the sidelines moved back into the market place starting in the spring. Buyer confidence was buoyed by a strong regional economy and declining contract mortgage rates over the course of the year”
Jason Mercer, TREB’s Chief Market Analyst, also adds.
“Over the last ten years, TREB has been drawing attention to the housing supply issue in the GTA. Increasingly, policy makers, research groups of varying scope and other interested parties have acknowledged that the lack of a diverse supply of ownership and rental housing continues to hamper housing affordability in the GTA. Taking 2019 as an example, we experienced a strong sales increase up against a decline in supply. Tighter market conditions translated into accelerating price growth. Expect further acceleration in 2020 if there is no relief on the supply front,”
UPDATE: In January 2020, TREB has since rebranded to TRREB, the Toronto Regional Real Estate Board.
The following data is a comparison between December 2018 and December 2019 numbers, and is current as of January 2020. For last month’s numbers, check out our previous infographic!
Or follow this link for all our TREB Infographics!
Click on the images for a larger view!
(Protip: Make sure to grab the printable PDF versions, too! It fits best when printed on A4-sized sheets, AND we’ve added an area on the sheet where you can attach your business card! 🙂 )
Download Printable Version – December 2019 TREB, Toronto Market Report
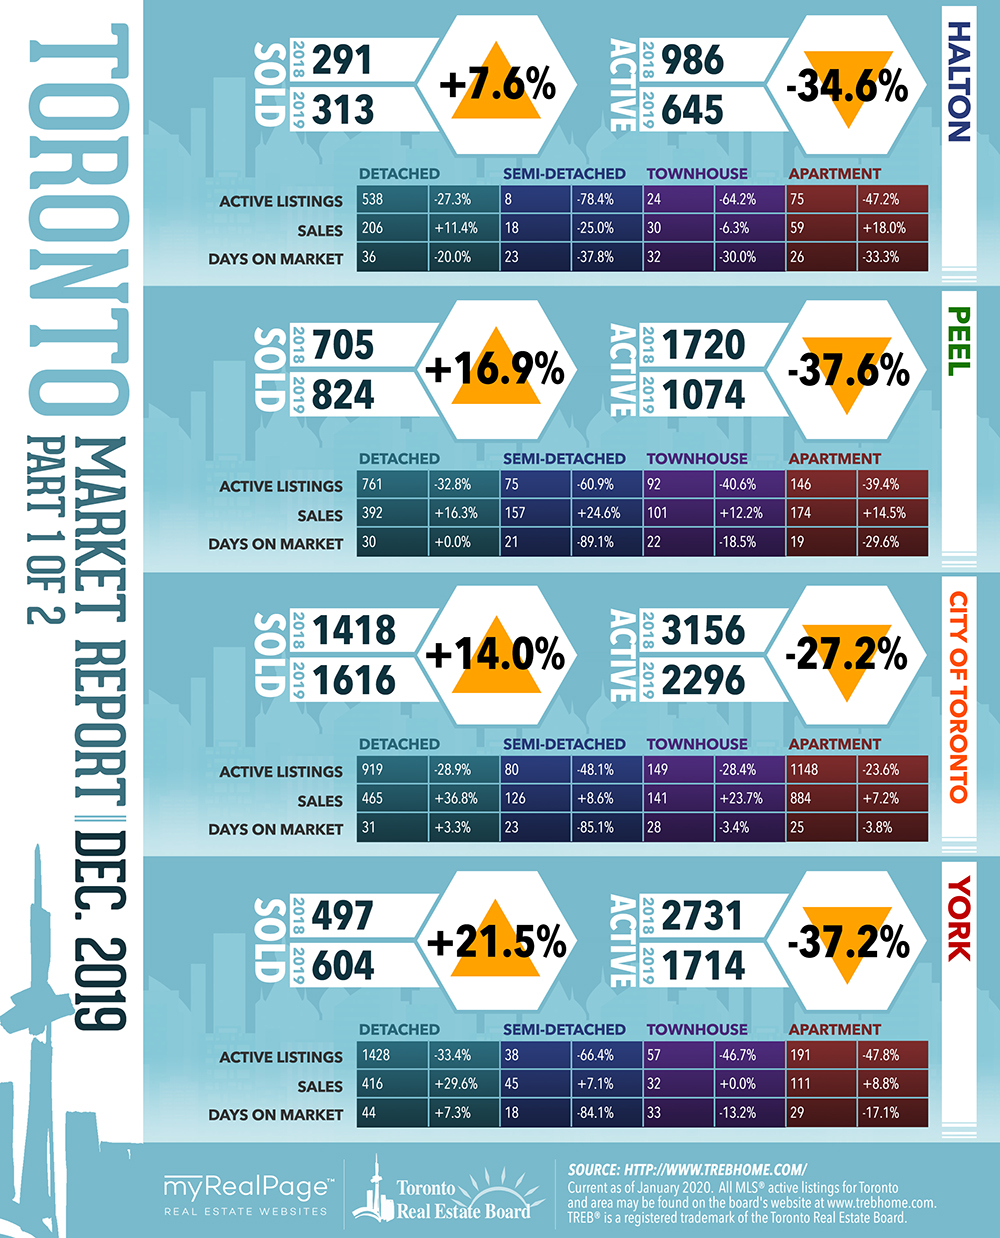

(Image Source: TREBhome.com)
Last Updated on July 25, 2022 by myRealPage
