INFOGRAPHICS: December 2019 VIREB Vancouver Island Market Reports

Ready to get started for 2020? It’s time for our monthly market updates for areas covered by the Vancouver Island Real Estate Board (VIREB)!
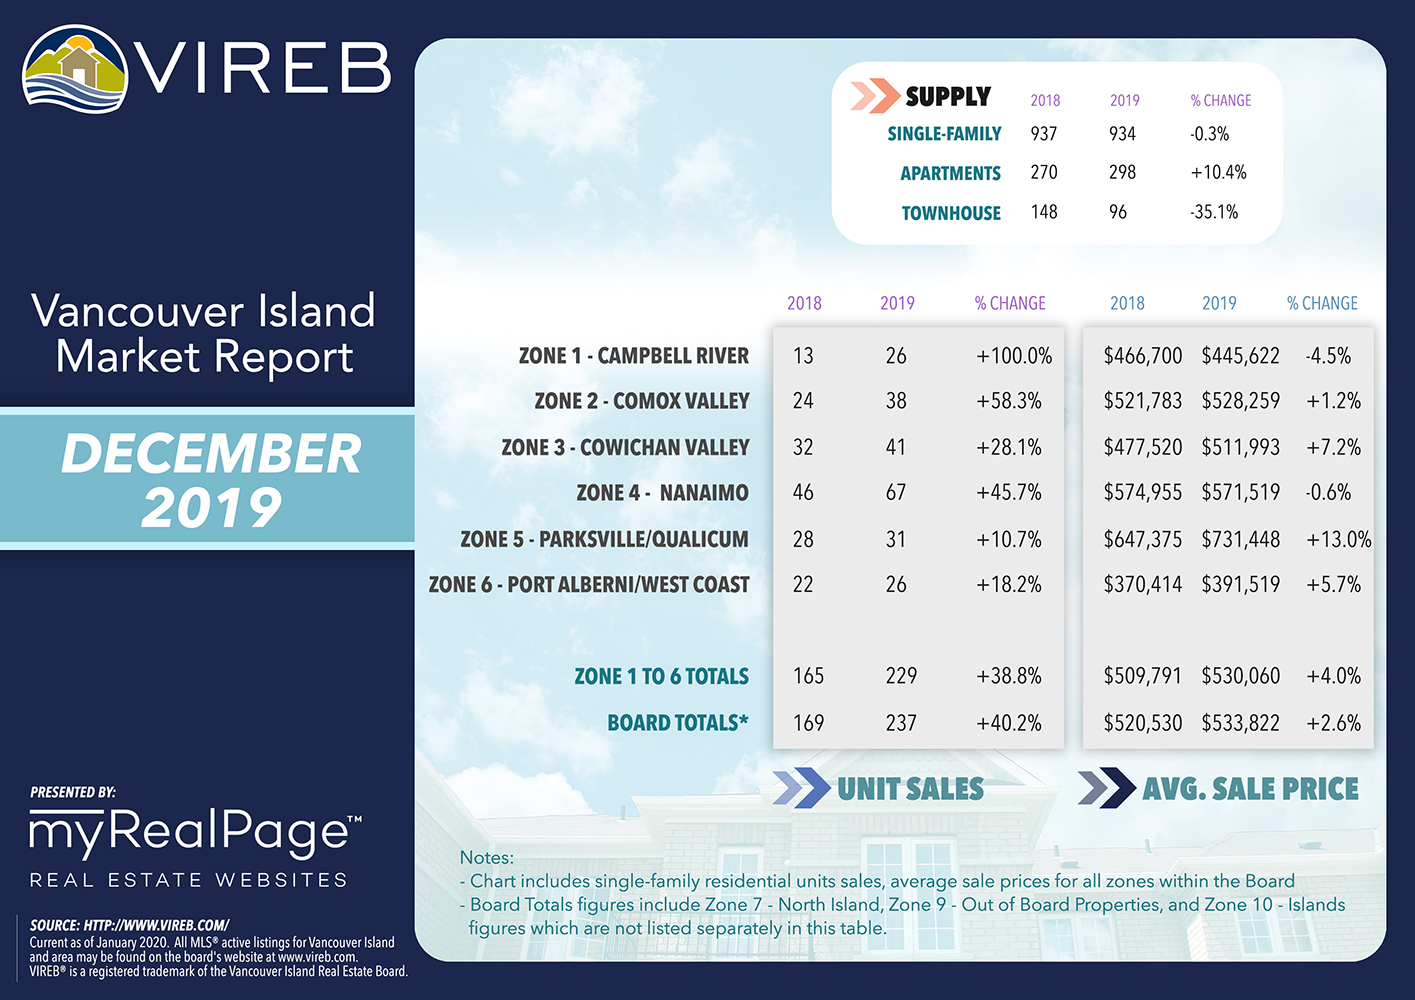
According to VIREB’s most recent market update, sales of single-family homes in December increased by 40% from one year ago and were 24% lower than in November. Last month, 237 single-family homes sold on the Multiple Listing Service® (MLS®) System compared to 312 in November and 169 one year ago.
Apartment sales in December rose by 68% year over year, while the number of townhouses sold dropped by 20% from one year ago. Annual sales of single-family homes in 2019 totaled 4,119, a 9% drop from 2018’s 4,539 sales.
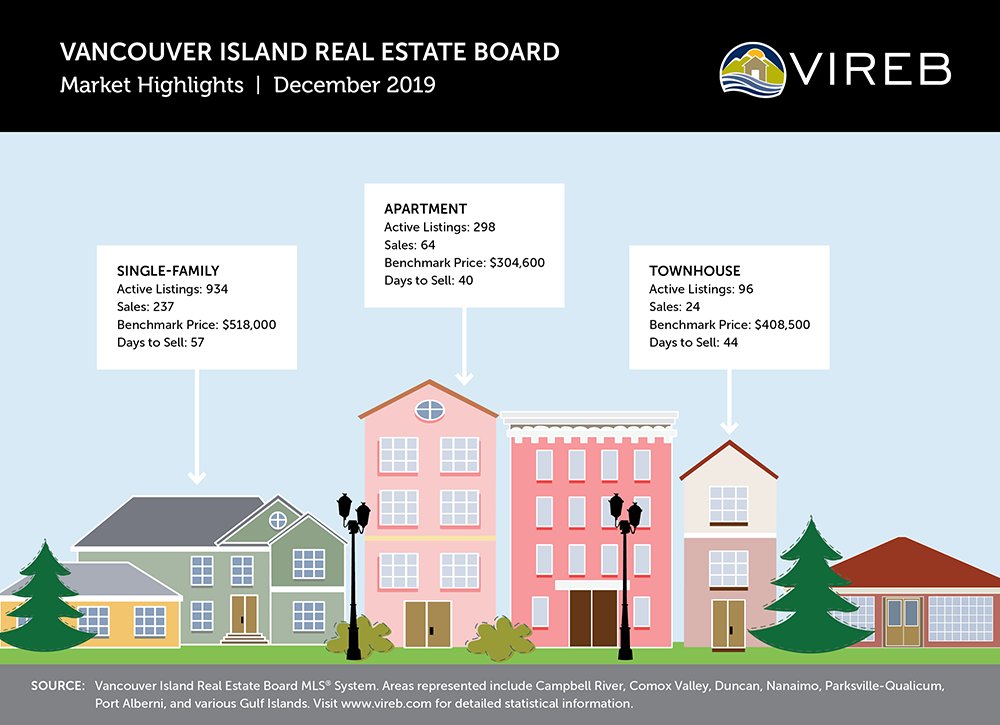
Inventory of single-family homes last month was virtually the same as in December 2018 (937 to 934) but dipped by 19% from November 2019. Active listings of apartments rose by 10% (270 to 298) year over year while townhouse inventory dropped by 35% (148 to 96).
The benchmark price of a single-family home board-wide was $518,000 in December, a 5% increase from one year ago and marginally higher than in November. (Benchmark pricing tracks the value of a typical home in the reported area.) In the apartment category, the year-over-year benchmark price rose by 4%, hitting $304,600, which was three%higher than in November. The benchmark price of a townhouse last month rose by 2% year over year and was slightly higher than in November, climbing to $408,500.
Trend-wise, VIREB’s housing market is balanced in most areas and inching towards a buyers’ market in a few zones. Overall, however, home sales and listing activity are at typical levels for our region. REALTORS® across the Island are reporting that there is interest among buyers, but many are taking a wait-and-see approach.
The following data is a comparison between December 2018 and December 2019 numbers, and is current as of January 2020. Click here to check out last month’s infographics.
You can also view all our VIREB infographics by clicking here.
Click on the images for a larger view!
(Protip: Make sure to grab the printable PDF versions, too! It fits best when printed on A4-sized sheets, AND we’ve added an area on the sheet where you can attach your business card! 🙂 )
Download Printable Version – December 2019 VIREB Market Report
(Image Source: VIREB Twitter)
Last Updated on July 25, 2022 by myRealPage
