INFOGRAPHICS: December 2022 TRREB Toronto Market Reports

A LOOK BACK AT THE 2022 GTA HOUSING MARKET
The Greater Toronto Area (GTA) housing market experienced a marked adjustment in 2022 compared to record levels in 2021. Existing affordability issues brought about by a lack of housing supply were exacerbated by sustained interest rate hikes by the Bank of Canada.
“Following a very strong start to the year, home sales trended lower in the spring and summer of 2022, as aggressive Bank of Canada interest rate hikes further hampered housing affordability. With no relief from the Office of Superintendent of Financial Institutions (OSFI) mortgage stress test or other mortgage lending guidelines including amortization periods, home selling prices adjusted downward to mitigate the impact of higher mortgage rates. However, home prices started levelling off in the late summer, suggesting the aggressive early market adjustment may be coming to an end,” said new Toronto Regional Real Estate Board (TRREB) President Paul Baron.
There were 75,140 sales reported through TRREB’s MLS® System in 2022 – down 38.2 per cent compared to the 2021 record of 121,639. The number of new listings amounted to 152,873 – down 8.2 per cent compared to 166,600 new listings in 2021. Seasonally adjusted monthly data for sales and price data show a marked flattening of the sales and price trends since the late summer.
Read the full report on TRREB website!
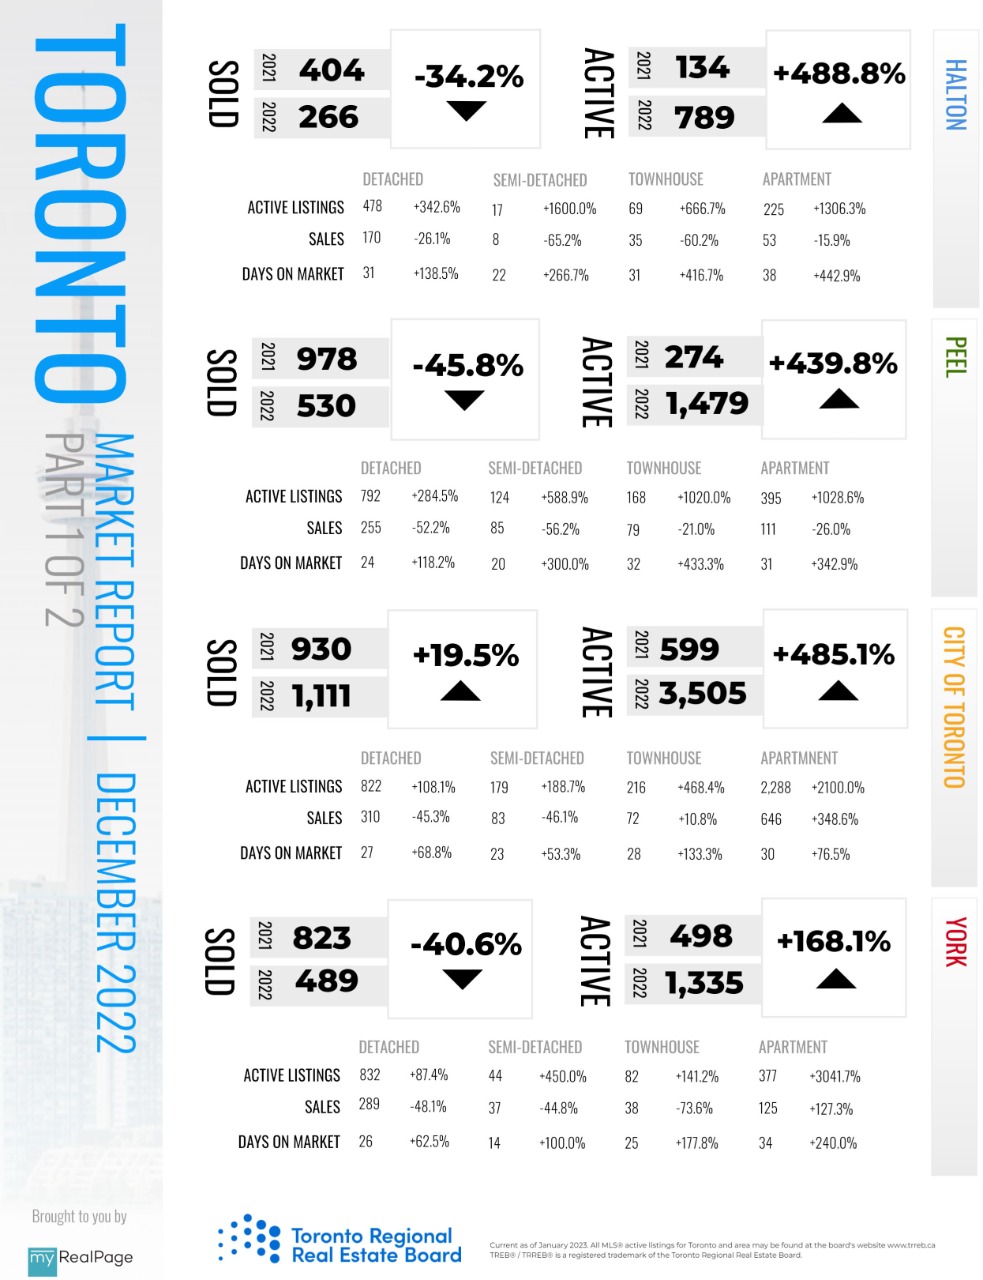
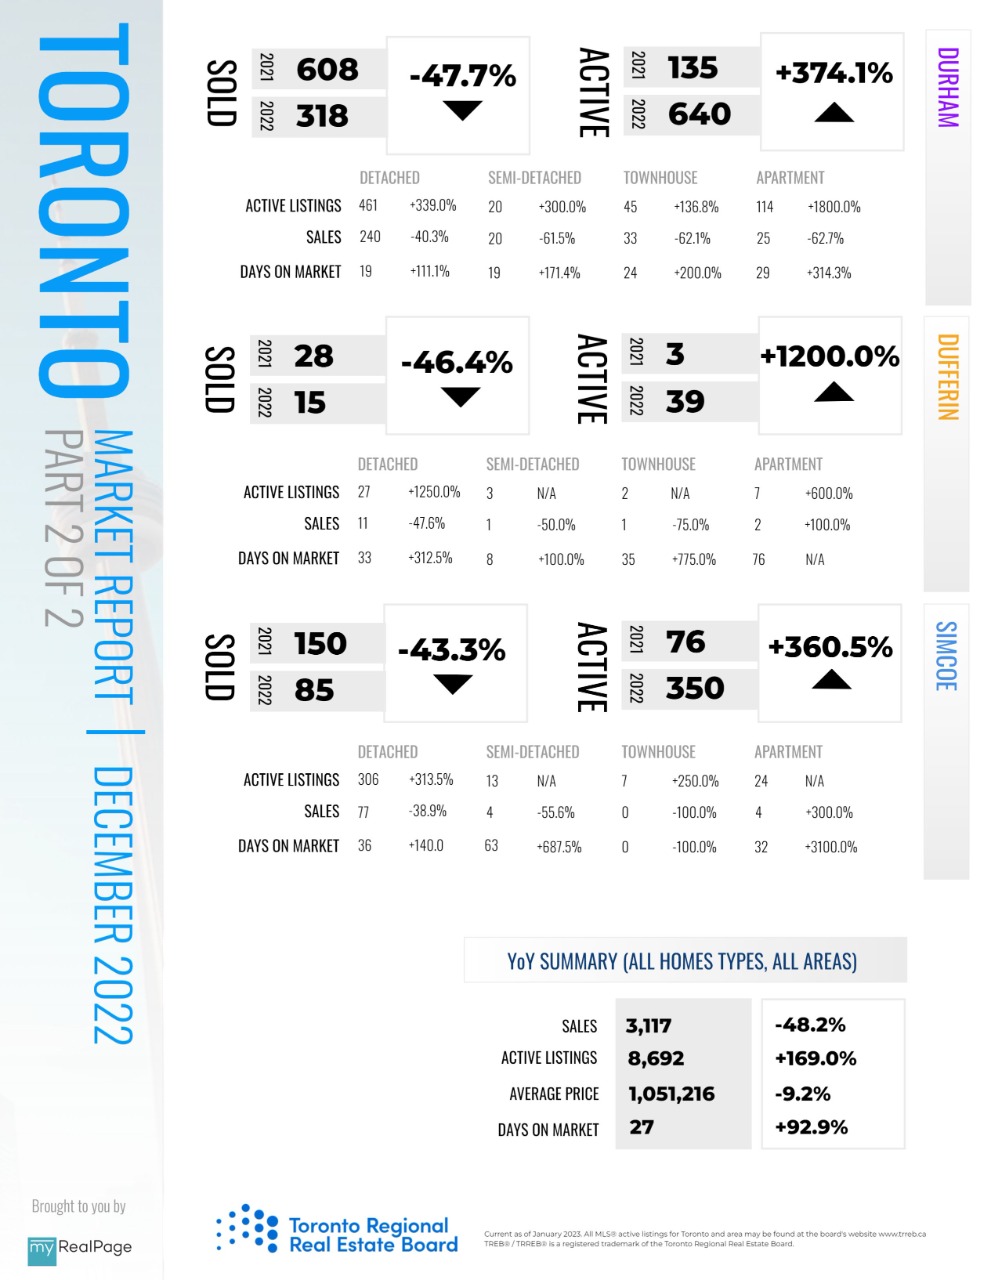
The following data is a comparison between December 2022 and December 2021 numbers, and is current as of January 2023. For last month’s numbers, check out our previous infographic!
Or follow this link for all our TREB / TRREB Infographics!
Download Printable Version – December 2022 TRREB, Toronto Market Report Part 1
Download Printable Version – December 2022 TRREB, Toronto Market Report Part 2
Last Updated on November 28, 2023 by myRealPage
