INFOGRAPHICS: December 2022 VREB Victoria Market Reports

The 2022 Victoria real estate market year in review
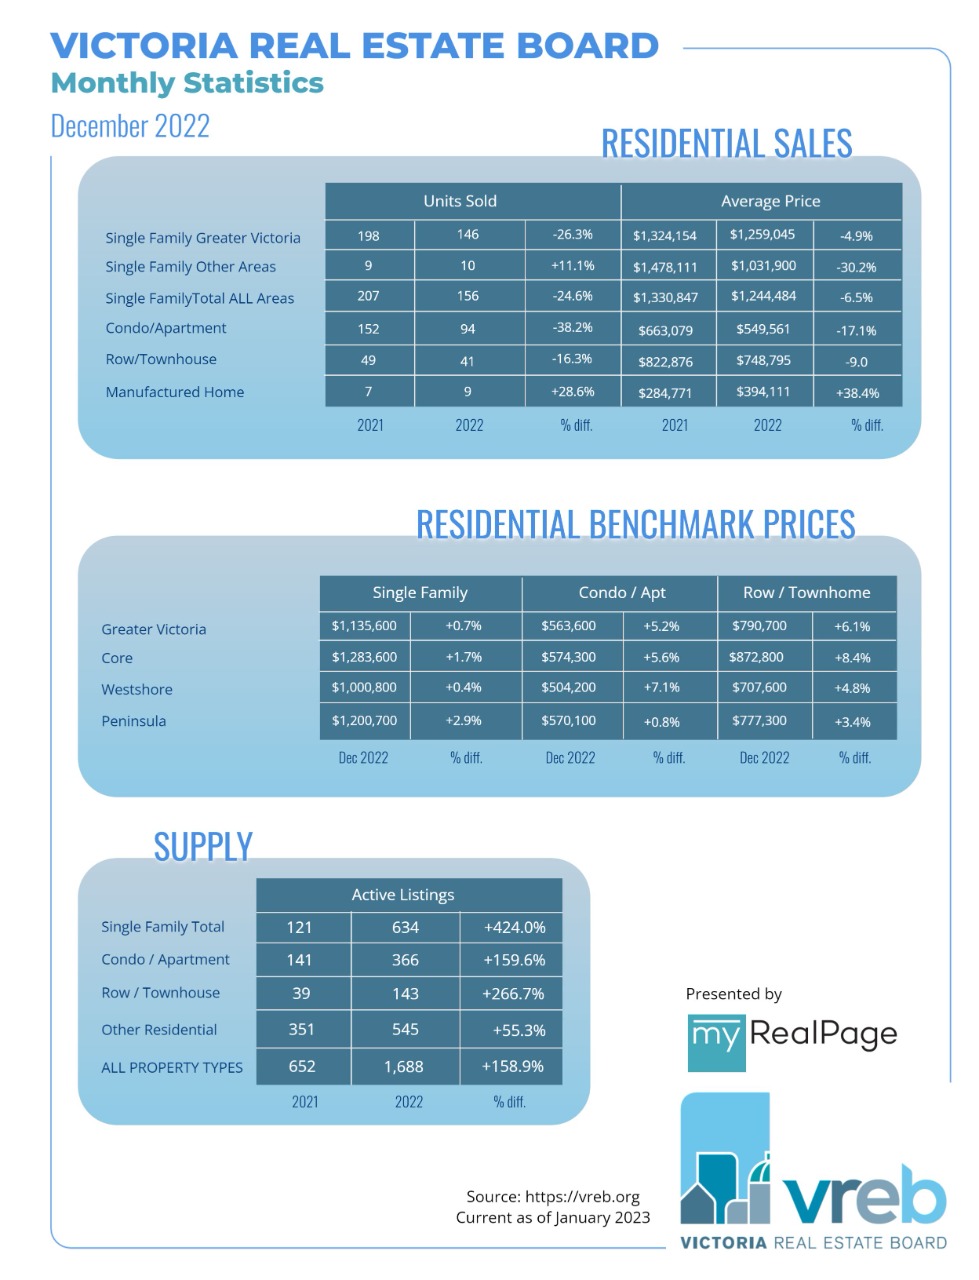
A total of 320 properties sold in the Victoria Real Estate Board region this December, 26.9 per cent fewer than the 438 properties sold in December 2021 and a 16.7 per cent decrease from November 2022. Sales of condominiums were down 38.2 per cent from December 2021 with 94 units sold. Sales of single family homes decreased 24.6 per cent from December 2021 with 156 sold.
A grand total of 6,804 properties sold over the course of 2022, 32.3 per cent fewer than the 10,052 that sold in 2021. 2022 sales came closest to 2014’s sales year when 6,698 properties were sold.
“We began the year with record low inventory, and with higher than average sales,” says 2022 Victoria Real Estate Board President Karen Dinnie-Smyth. “And then the market changed on a dime. Interest rate increases through the remainder of 2022 signalled the end of low-cost borrowing and pushed buyers to the sidelines. Each time interest rates went up, market activity slowed. As we head into 2023, we continue to see the cost of moving and borrowing money undermine demand. Slower sale activity has resulted in inventory levels rebounding from historic lows, which means there are more opportunities for buyers in our market this year than in recent years.”
Read the full report on VREB website!
The following data is a comparison between December 2022 and December 2021 numbers, and is current as of January 2023. Click here to check out last month’s figures!
You can also follow this link for all our Victoria Board monthly infographics!
Click on the images for a larger view!
Download Printable Version – December 2022 VREB, Victoria Market Report

Last Updated on November 28, 2023 by myRealPage


