INFOGRAPHICS: November 2022 VREB Victoria Market Reports

Victoria Real Estate Board Market Report for November 2022
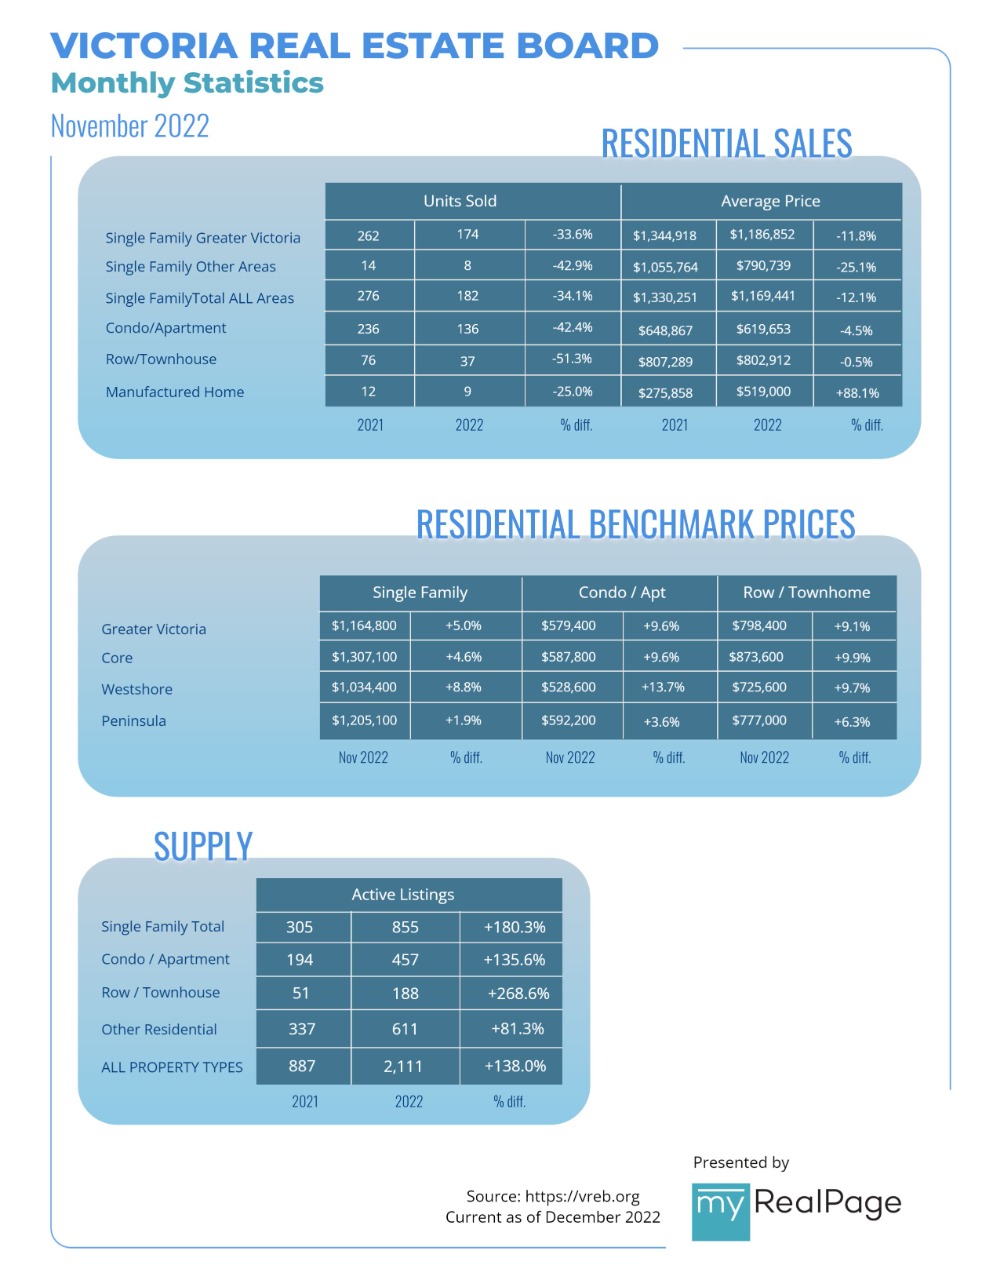
A total of 384 properties sold in the Victoria Real Estate Board region this November, 41.2 per cent fewer than the 653 properties sold in November 2021 and 20 per cent fewer than in October 2022. Sales of condominiums were down 42.4 per cent from November 2021 with 136 units sold. Sales of single family homes decreased 34.1 per cent from November 2021 with 182 sold.
“November saw a significant decrease from last year in the number of home sales recorded, but this was expected as the market continues to settle after the record setting pace of 2021,” says Victoria Real Estate Board President Karen Dinnie-Smyth. “With a small month over month decrease in price, the autumn market has returned to its traditional rhythm as we approach the holiday season. Inventory levels dipped slightly but remain well above this time last year, which is providing buyers with more options.”
There were 2,111 active listings for sale on the Victoria Real Estate Board Multiple Listing Service® at the end of November 2022, a decrease of 3.7 per cent compared to the previous month of October but a 138 per cent increase from the 887 active listings for sale at the end of November 2021.
Read the full report on VREB website!
The following data is a comparison between November 2022 and November 2021 numbers, and is current as of December 2022. Click here to check out last month’s figures!
You can also follow this link for all our Victoria Board monthly infographics!
Click on the images for a larger view!
Download Printable Version – November 2022 VREB, Victoria Market Report
Last Updated on November 28, 2023 by myRealPage
