INFOGRAPHICS: February 2019 CREB City And Region Market Reports

And just like that we’re entering the last month of the first quarter of 2019! Here are the latest housing market updates for areas covered by the Calgary Real Estate Board (CREB)!
According to CREB’s latest media release, the markets are still looking a little chilly as of February 2019.
Particularly, prices are being affected by weak sales activity and elevated inventory, mostly as a result of Calgary’s current economic climate.
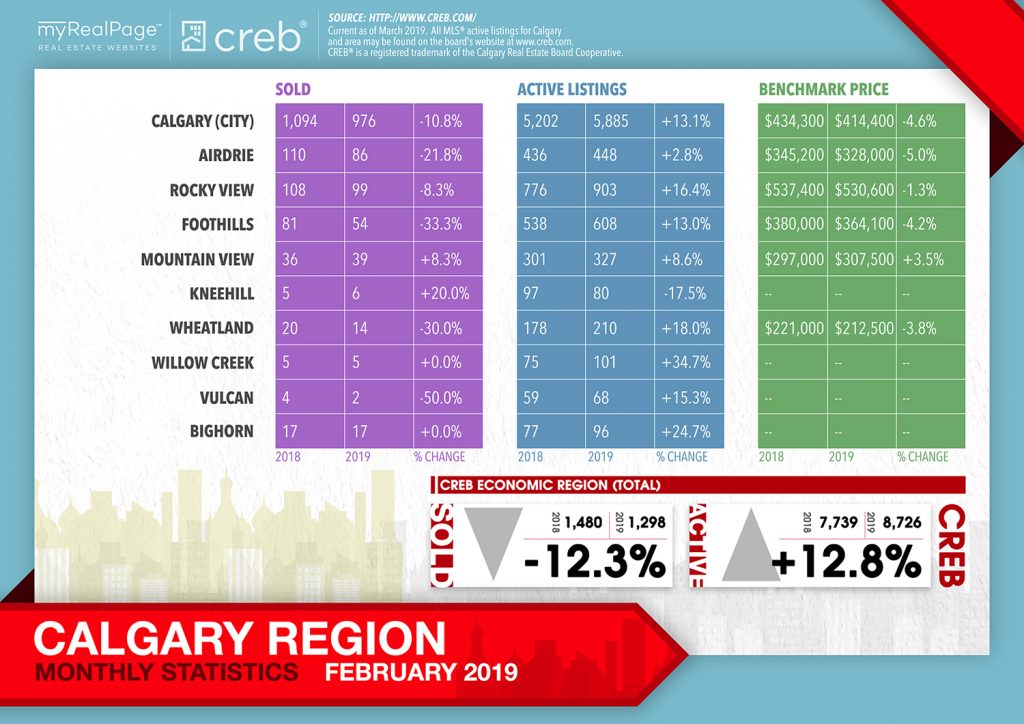
While the market remains oversupplied, slower sales and price declines do appear to be influencing sellers. New listings this month eased by eight per cent compared to last year for a total of 2,211 units. However, the 976 sales this month were not enough to substantially impact inventories levels, which remain elevated at 5,885 units.
As noted by CREB chief economist Ann-Marie Lurie,
“It is not a surprise that slowing activity in the housing market has persisted into February. There has been no substantial change in the economic climate and concerns regarding potential layoffs in the energy sector are weighing on confidence.”
Before we go, though, here’s some solid advice for home sellers, straight from Terry O’Reilly, during this interview at the recent CREB Forecast Conference and Trade Show!
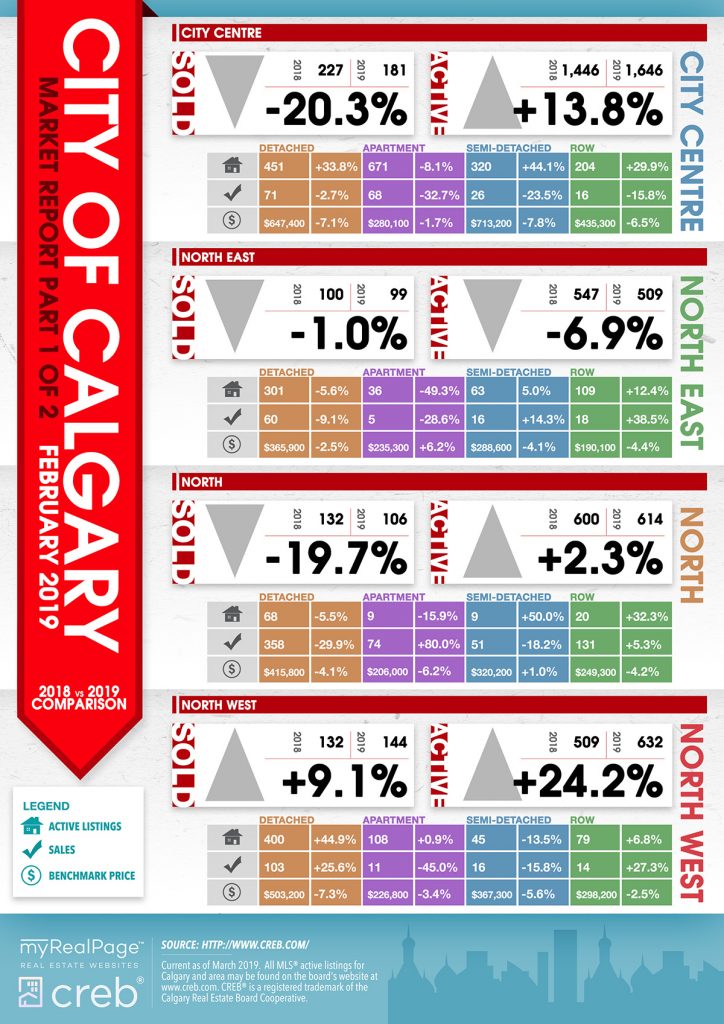
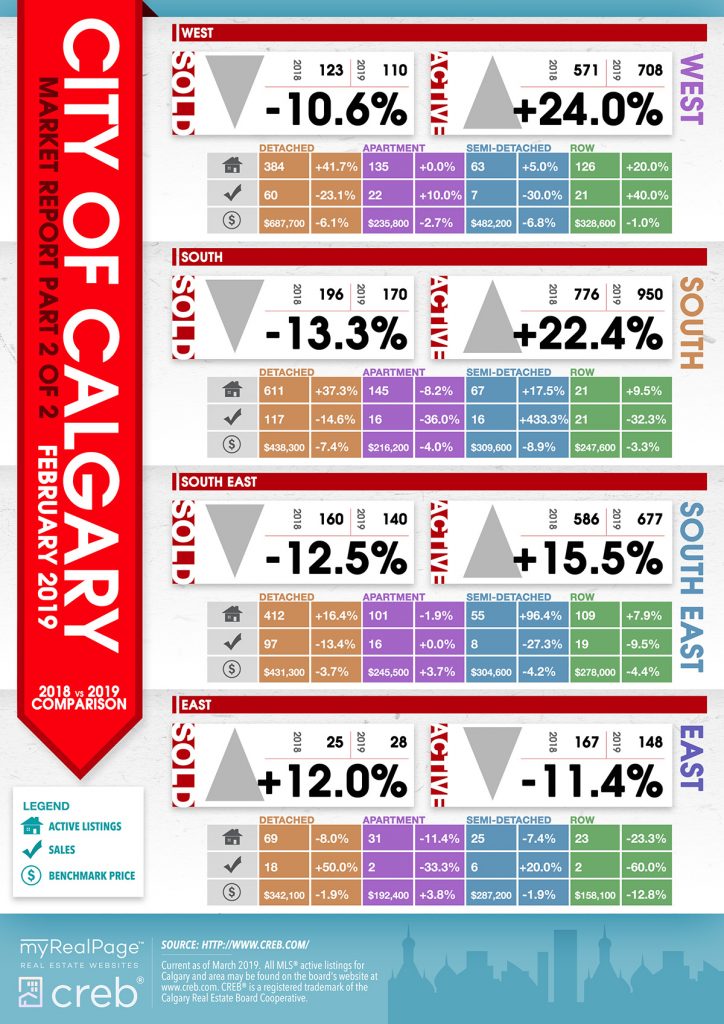
The following data is a comparison between February 2018 and February 2019 numbers, and is current as of March 2019. For last month’s numbers, check out our previous infographic.
Or follow this link for all our CREB Infographics!
Click on the images for a larger view!
(Protip: Make sure to grab the printable PDF versions, too! It fits best when printed on A4-sized sheets, AND we’ve added an area on the sheet where you can attach your business card! 🙂 )
Download Printable Version – February 2019 CREB, City of Calgary Report
Download Printable Version – February 2019 CREB, Calgary Region Report

(Image Source: CREB.com)
Last Updated on July 25, 2022 by myRealPage


