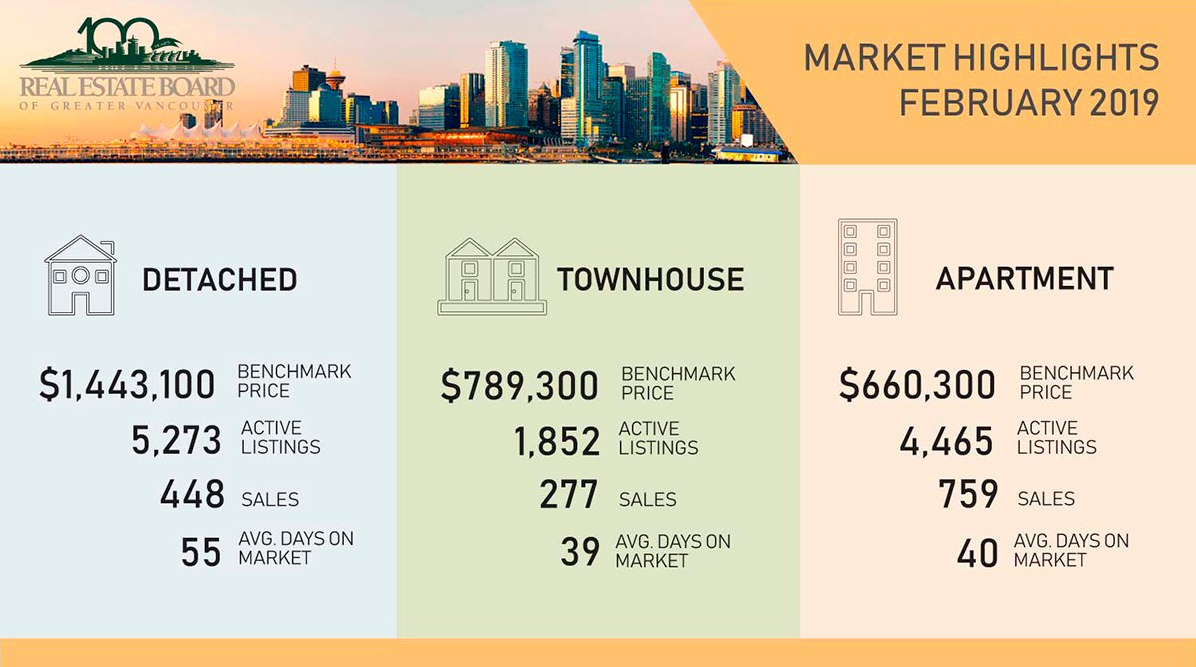
INFOGRAPHICS: February 2019 REBGV Greater Vancouver Market Reports

Spring Forward! It’s time for our monthly housing market stats for areas covered by the Real Estate Board of Greater Vancouver (REBGV)!
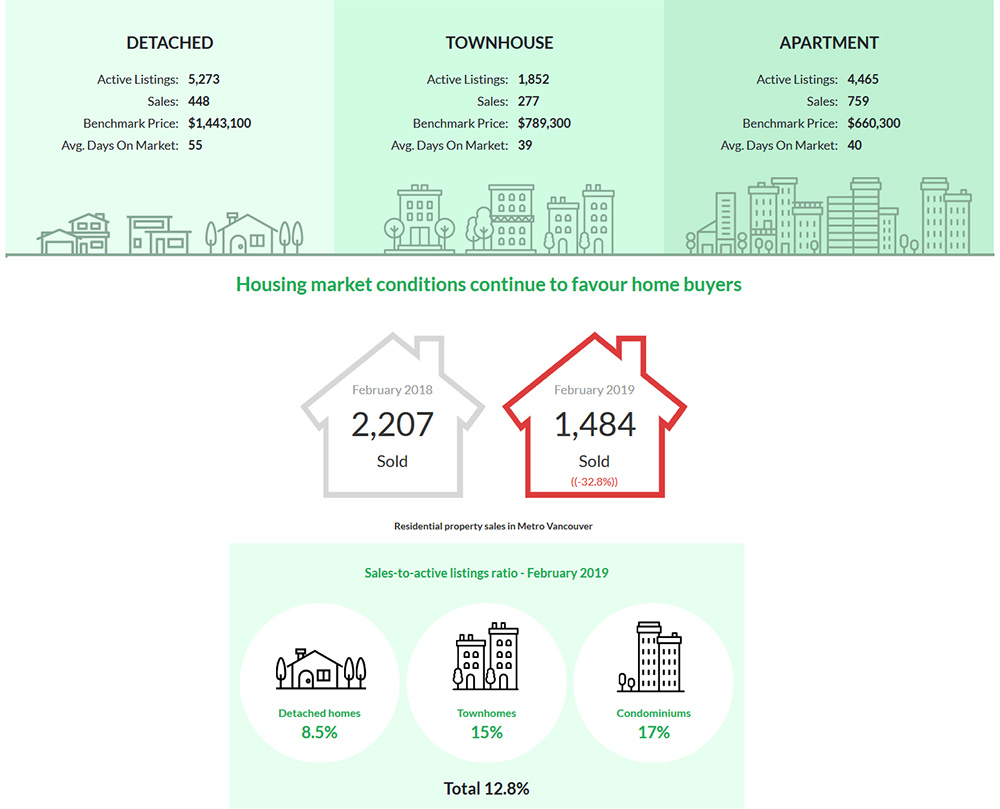
According to REBGV’s latest release, the Metro Vancouver housing market saw increased supply from home sellers and below average demand from home buyers in February, and last month’s sales were 42.5% below the 10-year February sales average.
The total number of homes currently listed for sale on the MLS® system in Metro Vancouver is 11,590, a 48.2% increase compared to February 2018 (7,822) and a 7.2% increase compared to January 2019 (10,808).
For all property types, the sales-to-active listings ratio for February 2019 is 12.8%.
REBGV President Phil Moore notes,
“For much of the past four years, we’ve been in a sellers’ market. Conditions have shifted over the last 12 months to favour buyers, particularly in the detached home market. This means that home buyers face less competition today, have more selection to choose from and more time to make their decisions.
Homes priced well for today’s market are attracting interest, however, buyers are choosing to take a wait-and-see approach for the time being. REALTORS® continue to experience more traffic at open houses. We’ll see if this trend leads to increased sales activity during the spring market.”
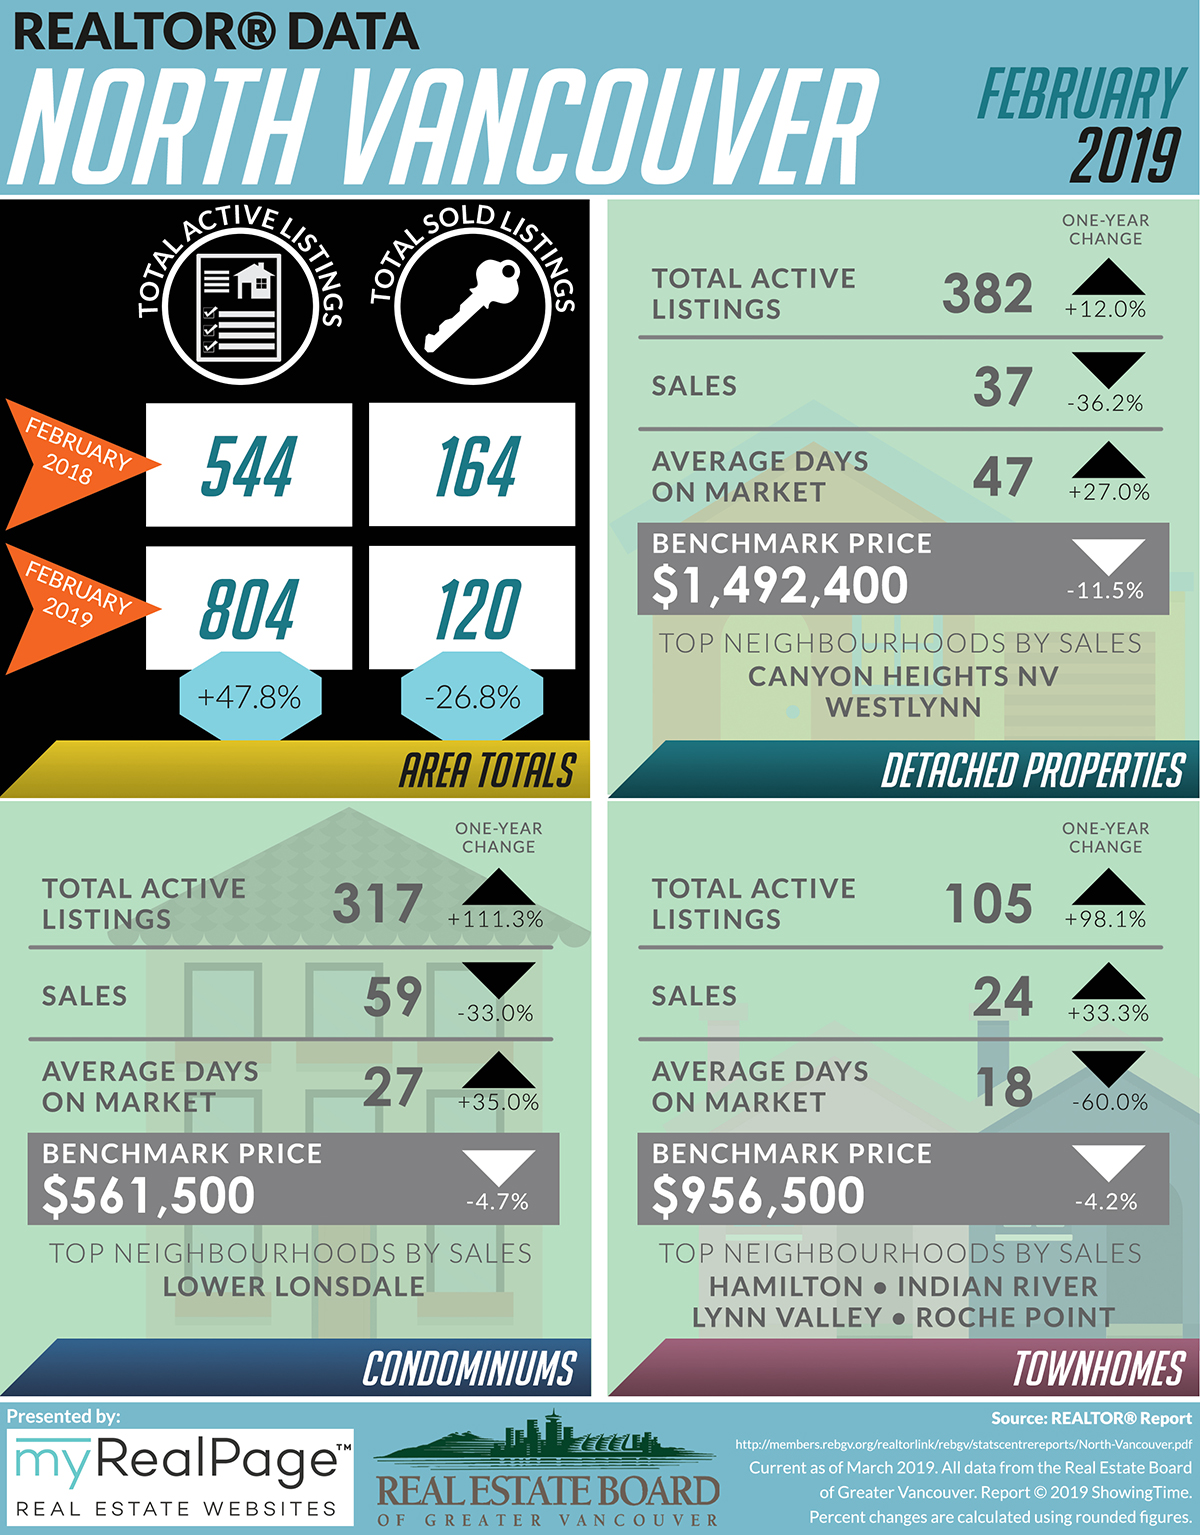
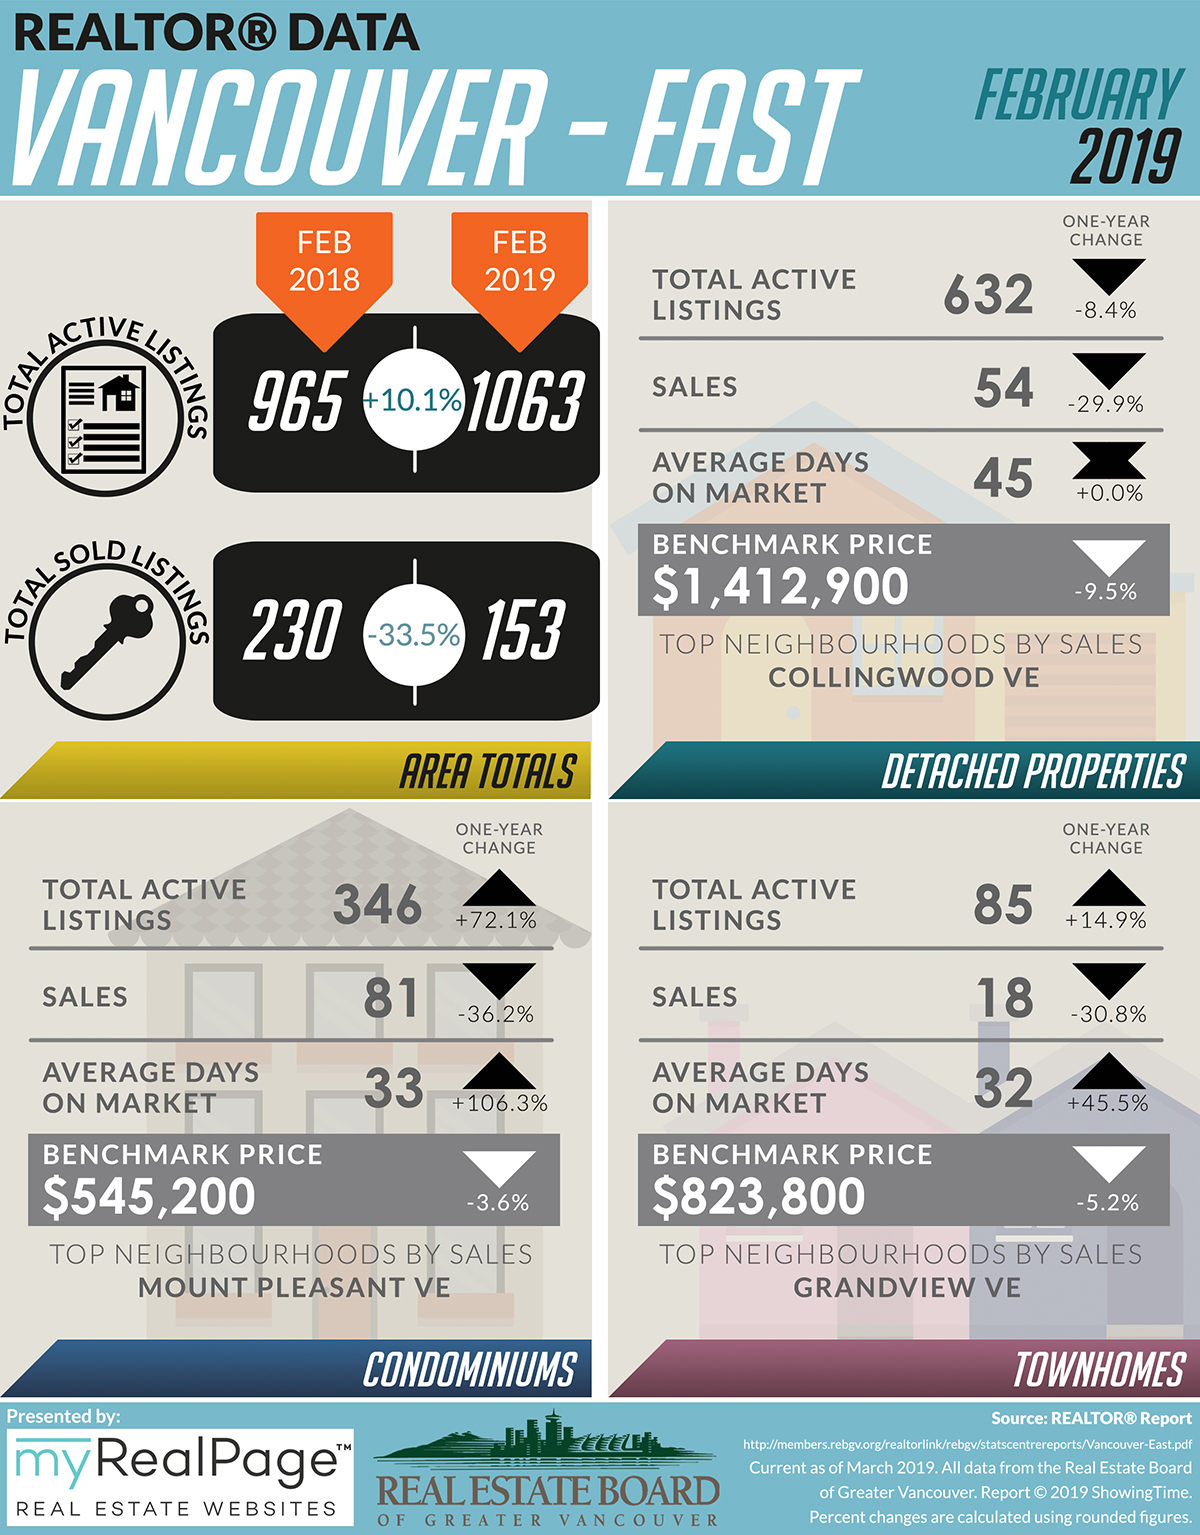
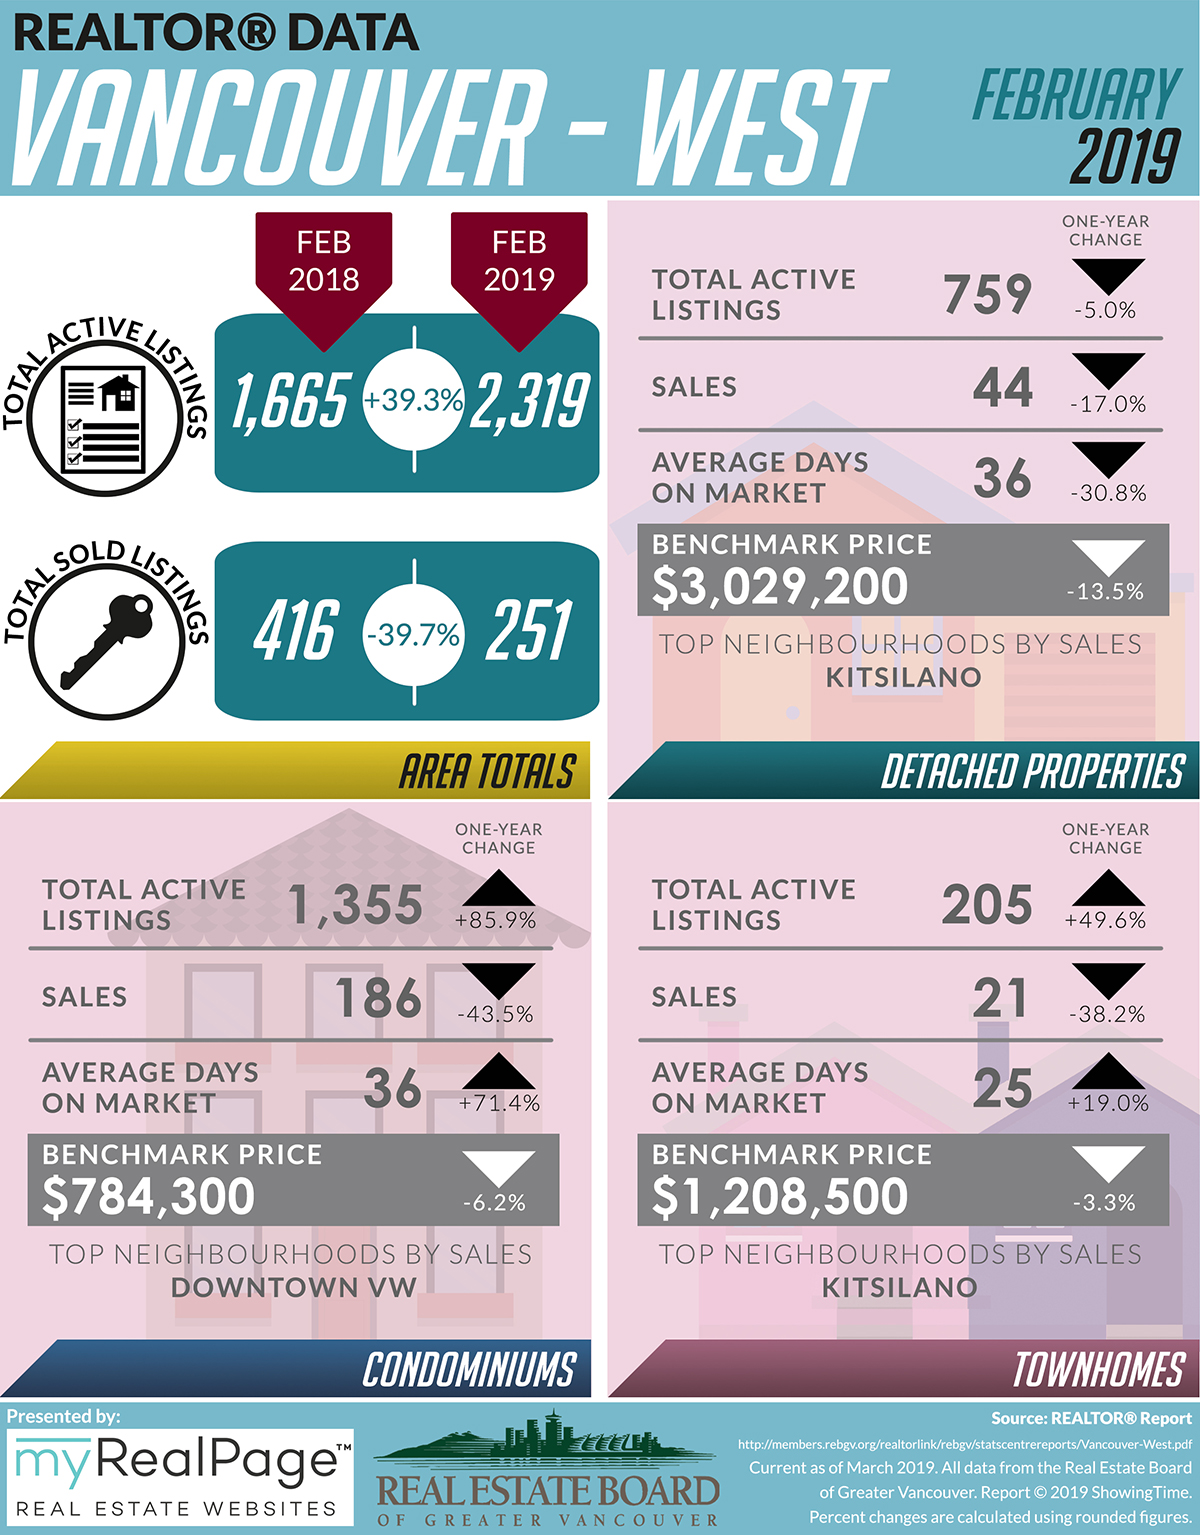
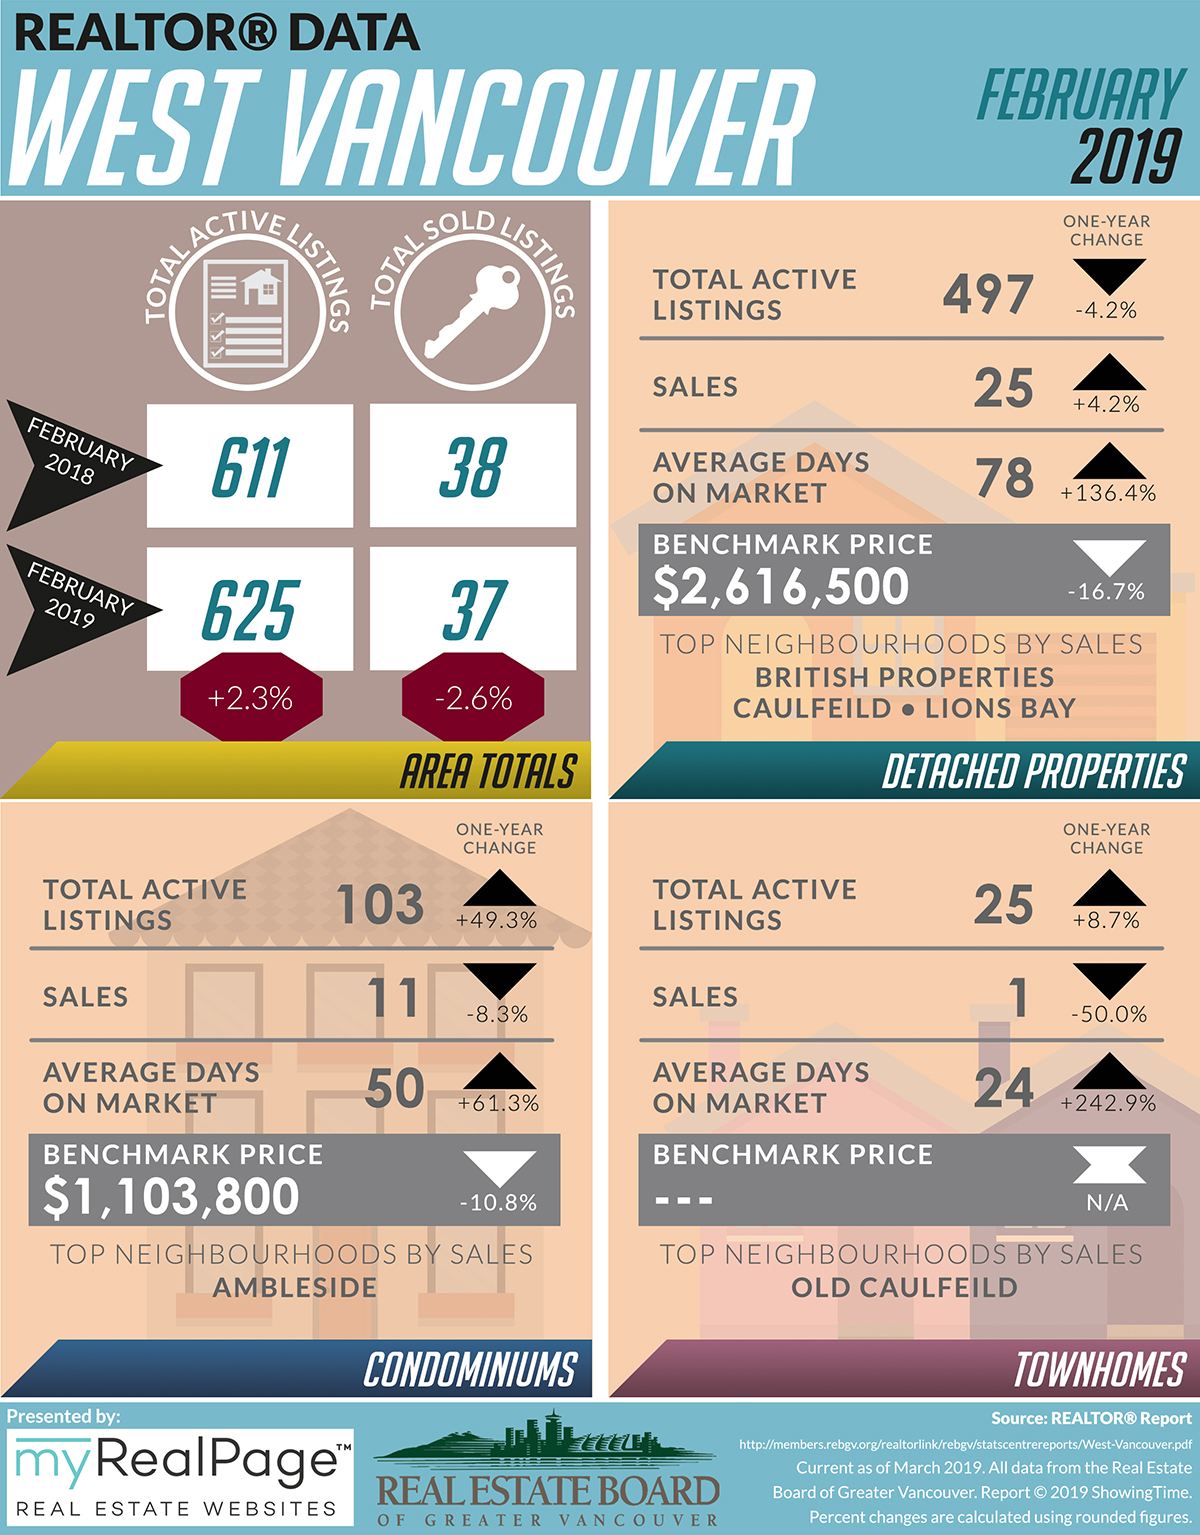
The following data is a comparison between February 2018 and February 2019 numbers, and is current as of March 2019. For last month’s update, you can check out our previous post for January 2019 data.
Or follow this link for all our REBGV Infographics!
These infographics cover current trends in North Vancouver, West Vancouver, Vancouver East, and Vancouver West.
Click on the images for a larger view!
(Protip: Make sure to grab the printable PDF versions, too! It fits best when printed on A4-sized sheets, AND we’ve added an area on the sheet where you can attach your business card! 🙂 )
Download Printable Version – REBGV February 2019 Data Infographics
(Image Source: REBGV.org)
(Image Source: REBGV Twitter)
Last Updated on July 25, 2022 by myRealPage
