INFOGRAPHICS: February 2019 TREB Toronto Market Reports

Spring is in the air, and here are the latest real estate market updates for areas covered by the Toronto Real Estate Board (TREB)!
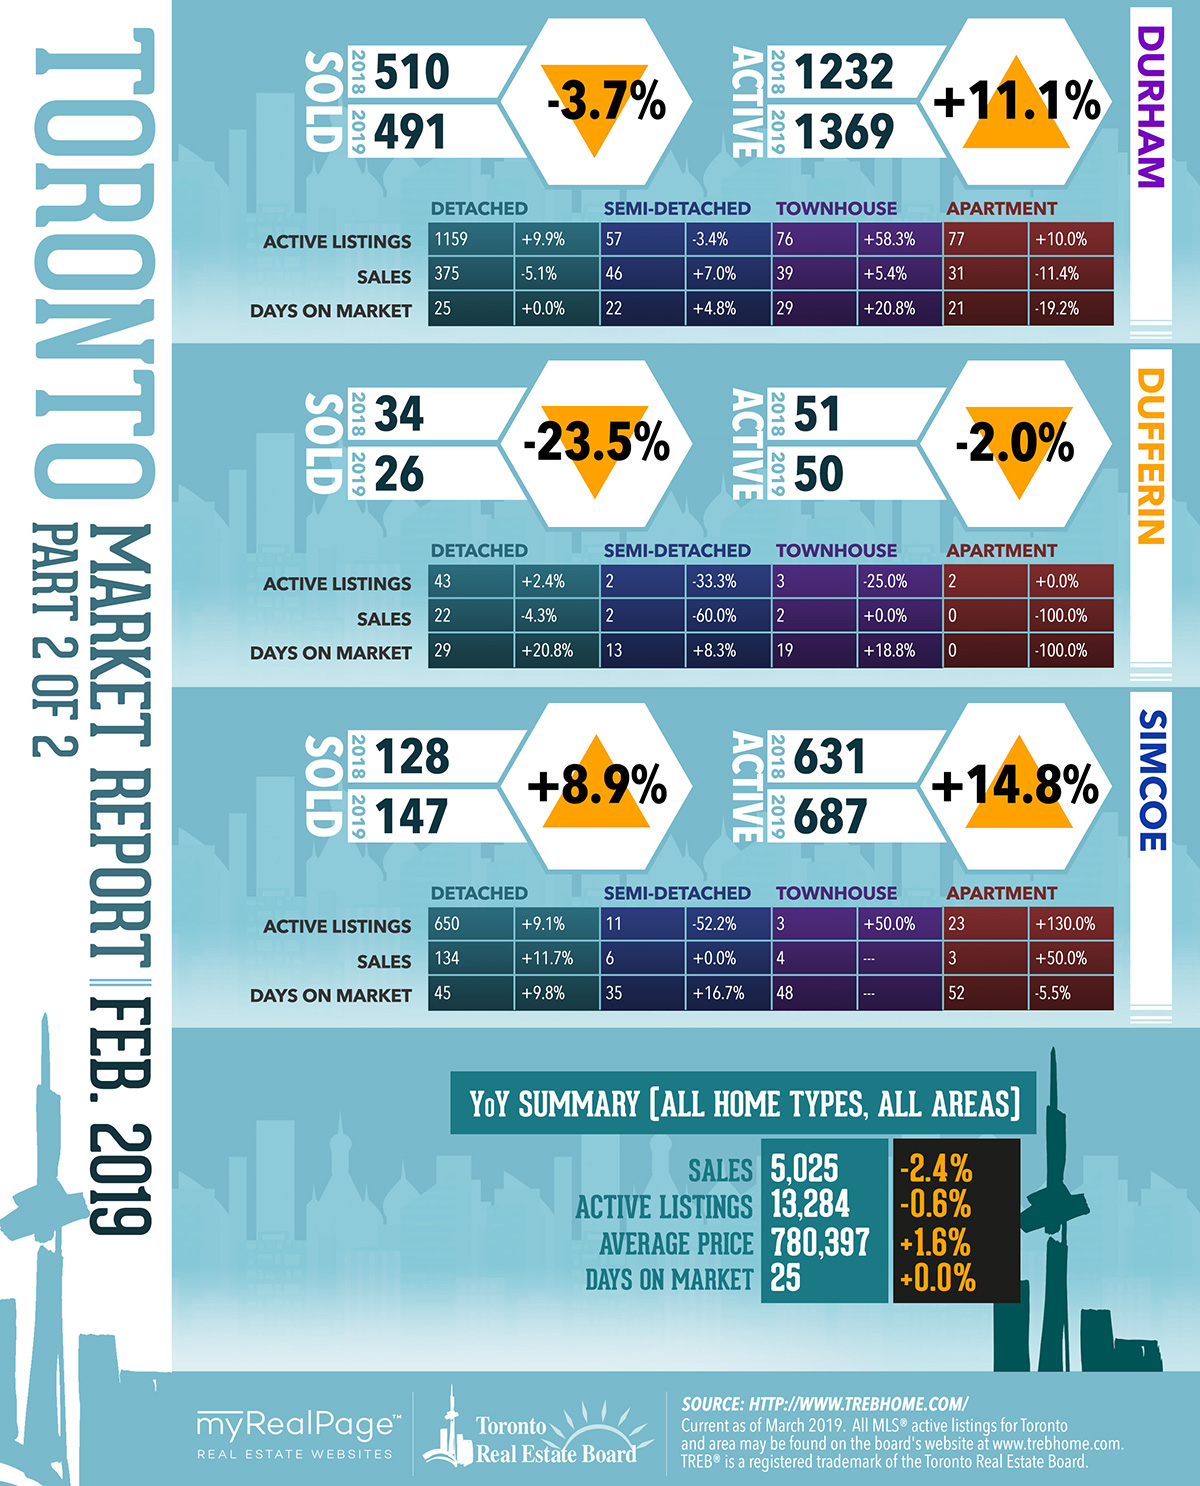
In their most recent market report, TREB President Garry Bhaura announced that Greater Toronto Area REALTORS® reported 5,025 homes sold through TREB’s MLS® System in February 2019. This sales total was down by 2.4% on a year-over-year basis. Sales were also down compared to January 2019 following preliminary seasonal adjustment.
Despite sales being down year-over-year, new listings actually declined by a greater annual rate. This suggests that market conditions became tighter compared to last year. Tighter market conditions continued to support year-over-year average price growth.
According to Mr. Bhaura,
“The OSFI mandated mortgage stress test has left some buyers on the sidelines who have struggled to qualify for the type of home they want to buy.
The stress test should be reviewed and consideration should be given to bringing back 30 year amortizations for federally insured mortgages. There is a federal budget and election on the horizon.
It will be interesting to see what policy measures are announced to help with home ownership affordability.”
Jason Mercer, TREB’s Director of Market Analysis and Service Channels, also adds,
“Home sales reported through TREB’s MLS® System have a substantial impact on the Canadian economy.
A study conducted by Altus for TREB found that, on average, each home sale reported through TREB resulted in $68,000 in spin-off expenditures accruing to the economy. With sales substantially lower than the 2016 record peak over the last two years, we have experienced a hit to the economy in the billions of dollars, in the GTA alone.
This hit has also translated into lower government revenues and, if sustained, could impact the employment picture as well.”
UPDATE: In January 2020, TREB has since rebranded to TRREB, the Toronto Regional Real Estate Board.
The following data is a comparison between February 2018 and February 2019 numbers, and is current as of March 2019. For last month’s numbers, check out our previous infographic!
Or follow this link for all our TREB Infographics!
Click on the images for a larger view!
(Protip: Make sure to grab the printable PDF versions, too! It fits best when printed on A4-sized sheets, AND we’ve added an area on the sheet where you can attach your business card! 🙂 )
Download Printable Version – February 2019 TREB, Toronto Market Report

Last Updated on July 25, 2022 by myRealPage
