INFOGRAPHICS: February 2020 CREB City And Region Market Reports

We are now steadily moving into the month of March, and here are the latest housing market updates for areas covered by the Calgary Real Estate Board (CREB)!
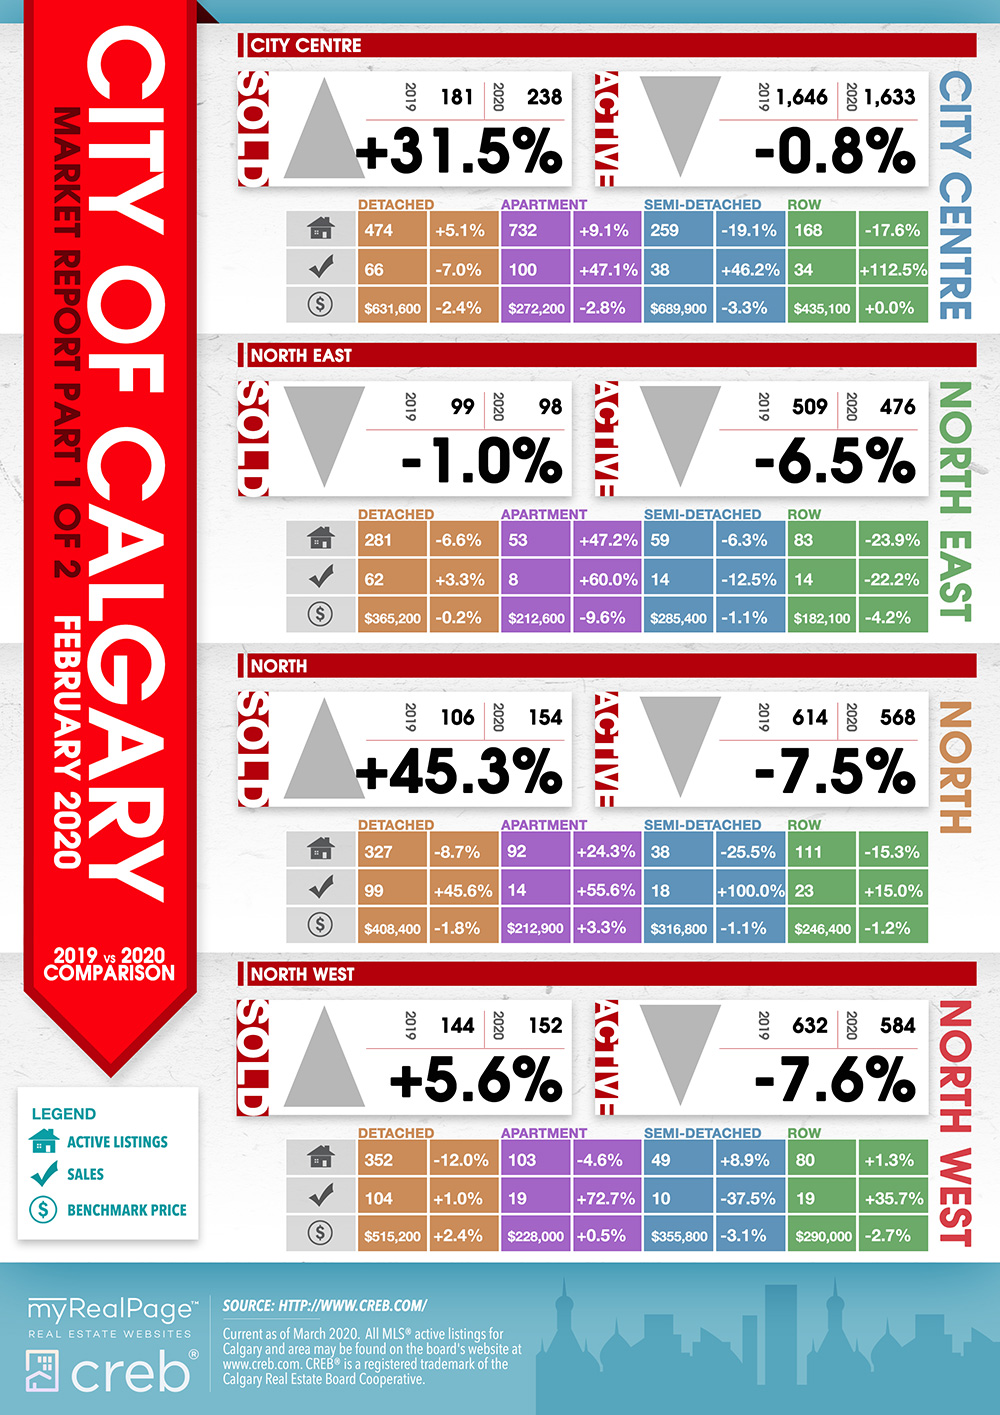
According to CREB’s latest media release, home sales see a bump and February saw a double-digit gain in sales, but last February was one of the slowest levels of activity since the late ’90s.
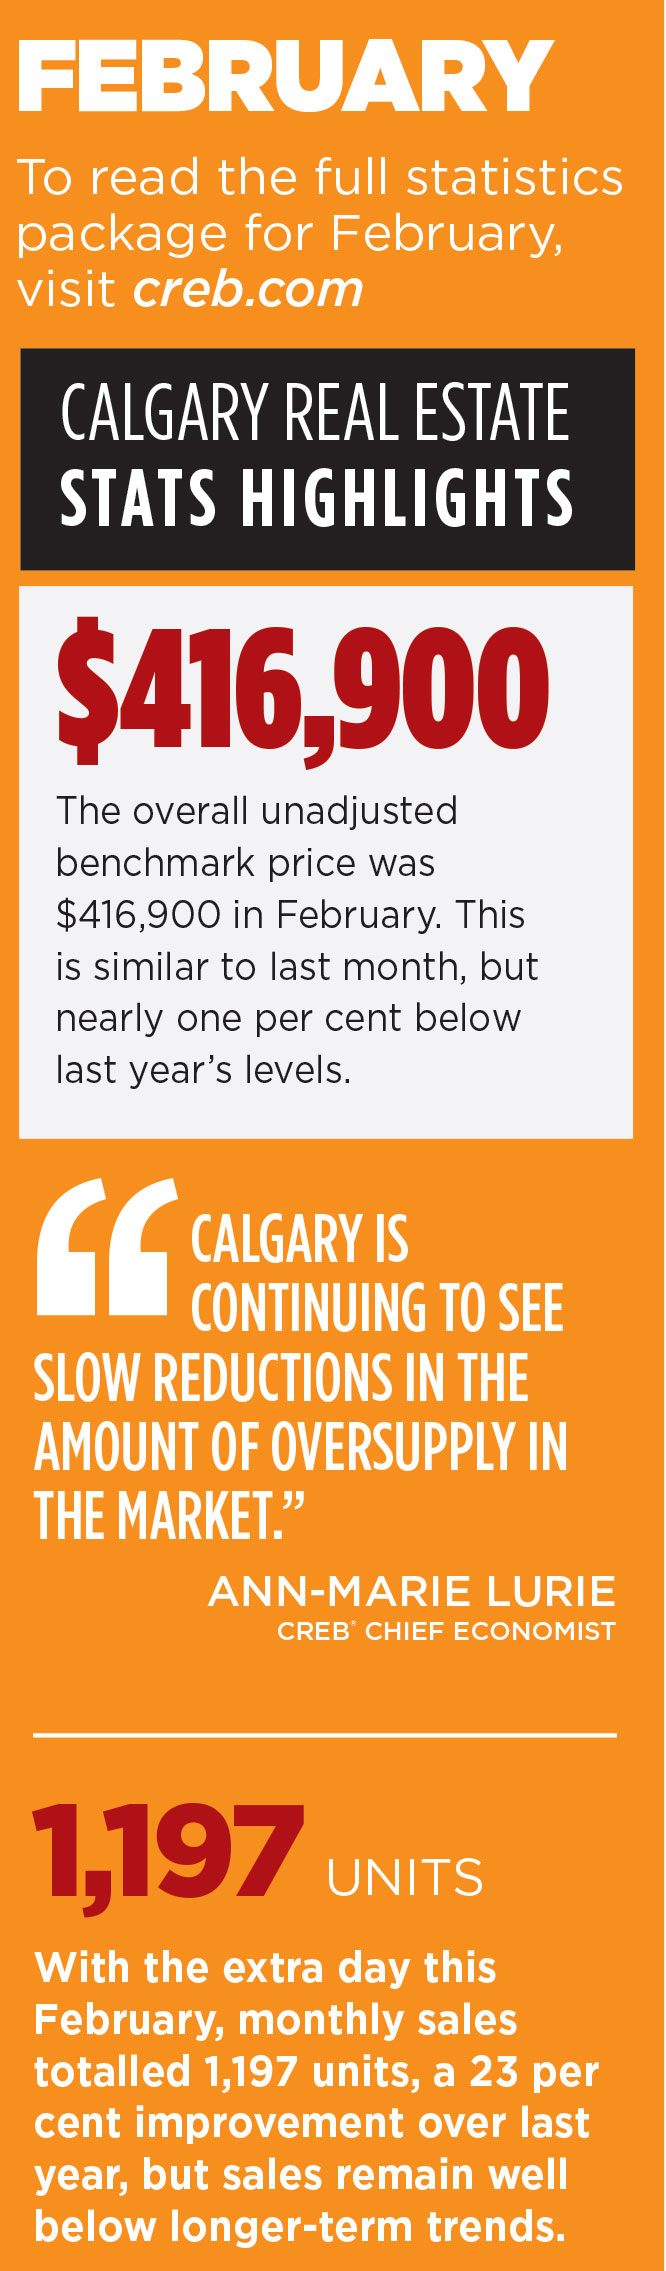
With the extra day this February, monthly sales totaled 1,197 units. A combination of these two factors resulted in a 23% improvement over last year, but sales remain well below longer-term trends and consistent with the lower levels reported over the past five years.
As noted by CREB chief economist Ann-Marie Lurie,
“However, this should not diminish the fact that conditions are still improving.
Calgary is continuing to see slow reductions in the amount of oversupply in the market, from modest changes in demand and reductions in supply. This needs to occur before we can see more stability in prices.”
The overall unadjusted benchmark price was $416,900 in February. This is similar to last month, but nearly 1% below last year’s levels. Overall, prices remain nearly 11% below the monthly high recorded in 2014.
The following data is a comparison between February 2019 and February 2020 numbers, and is current as of March 2020. For last month’s numbers, check out our previous infographic.
Or follow this link for all our CREB Infographics!
Click on the images for a larger view!
(Protip: Make sure to grab the printable PDF versions, too! It fits best when printed on A4-sized sheets, AND we’ve added an area on the sheet where you can attach your business card! 🙂 )
Download Printable Version – February 2020 CREB, City of Calgary Report
Download Printable Version – February 2020 CREB, Calgary Region Report


(Image Source: CREBnow.com)
Last Updated on July 25, 2022 by myRealPage
