INFOGRAPHICS: February 2020 FVREB Fraser Valley, South Surrey, Etc. Market Reports

Spring is almost here, and the market that goes along with it. Here are this month’s market updates for the Fraser Valley Real Estate Board (FVREB)!
According to their latest published figures, in February, property sales in the Fraser Valley finished slightly above the 10-year average for the month, while new listings came in 3% below, keeping overall inventory at historically below-average levels.
The Fraser Valley Real Estate Board processed 1,352 sales of all property types on its Multiple Listing Service® (MLS®) in February, a 39% increase compared to sales in January 2020, and a 38% increase compared to the 982 sales in February of last year.
Of the 1,352 total MLS® sales of residential and commercial combined in the Fraser Valley, 534 were single family detached homes, 341 were townhouses, and 315 were apartments.
There were 5,741 active listings available in the Fraser Valley at the end of February, an increase of 12% compared to January’s inventory and a decrease of 10% year-over-year.
Additionally, 2,557 new listings were received by the Board for the month, a 15% increase compared to January’s intake of 2,216 new listings and a 15% decrease compared to February of last year.
As noted by Darin Germyn, President of the Board,
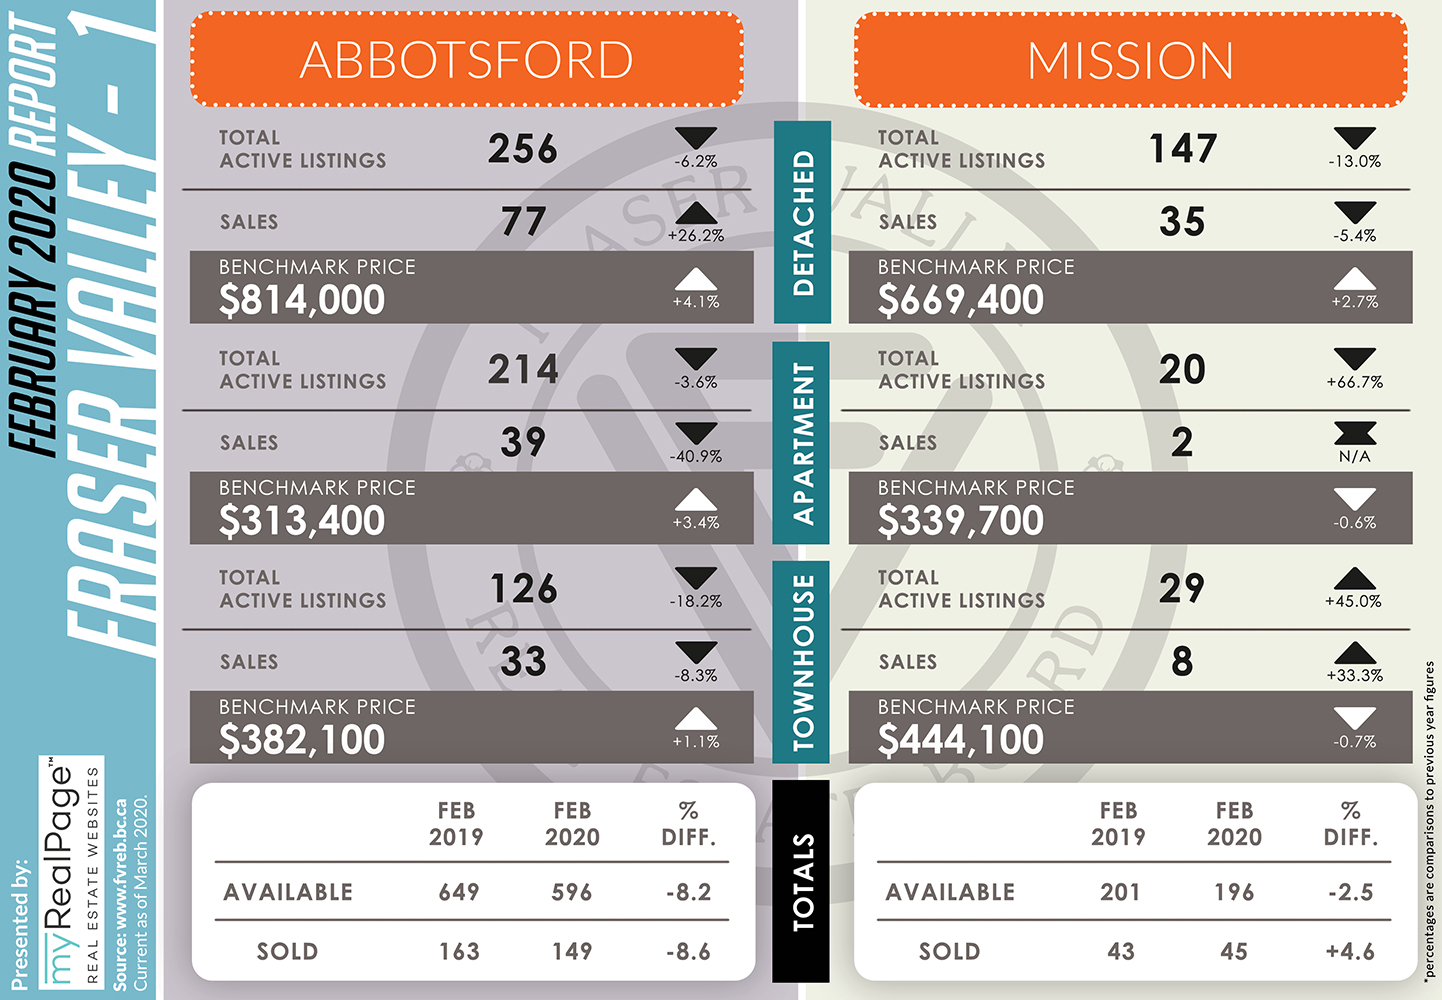
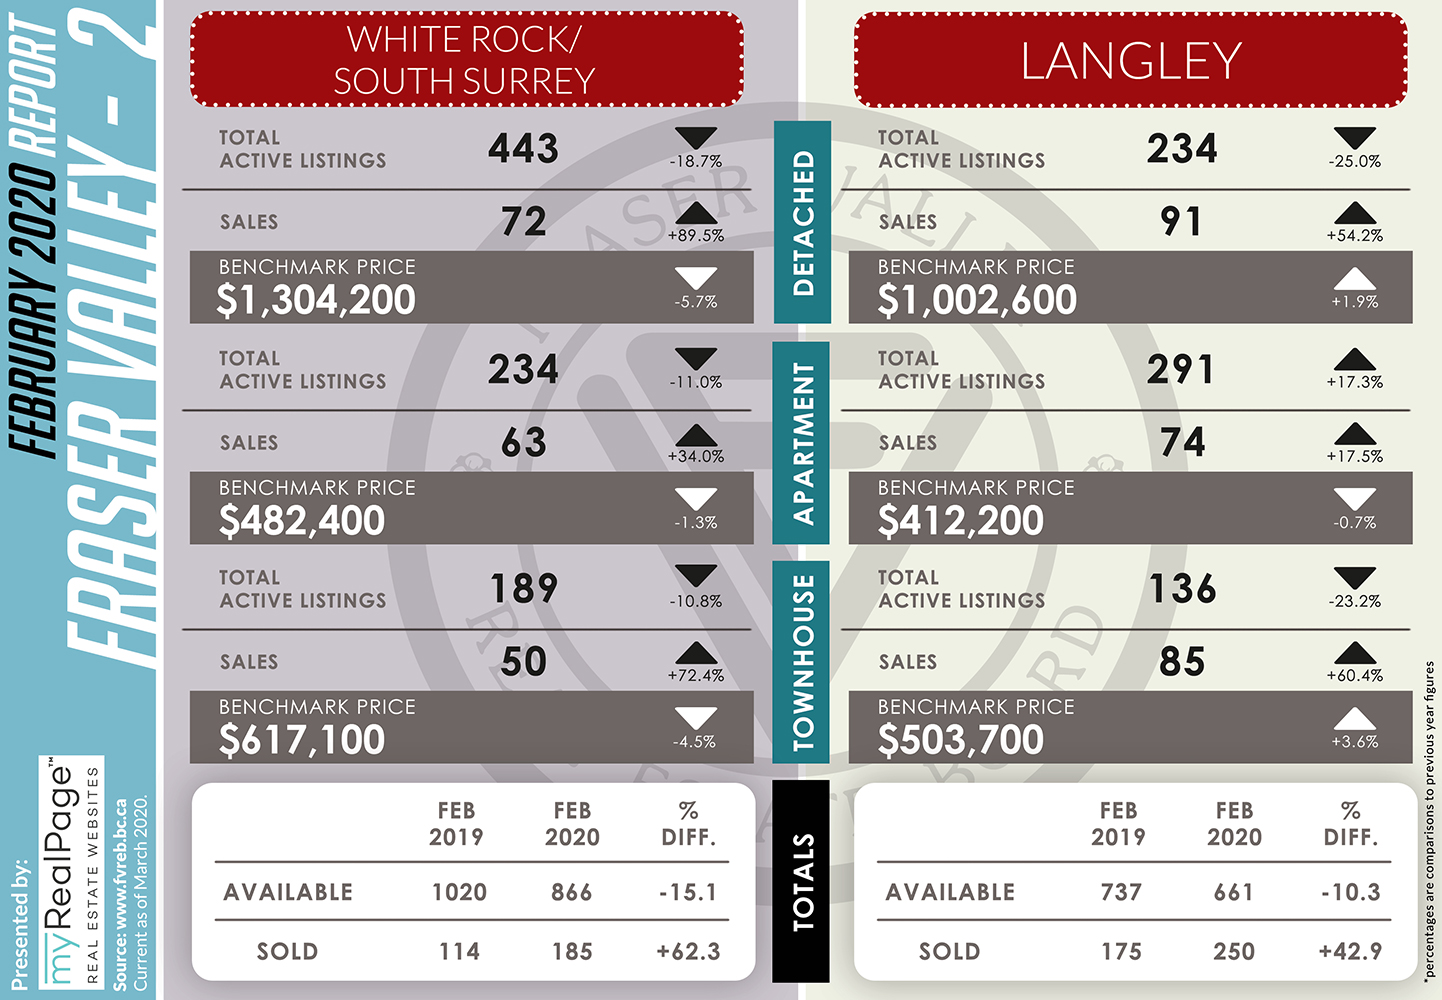
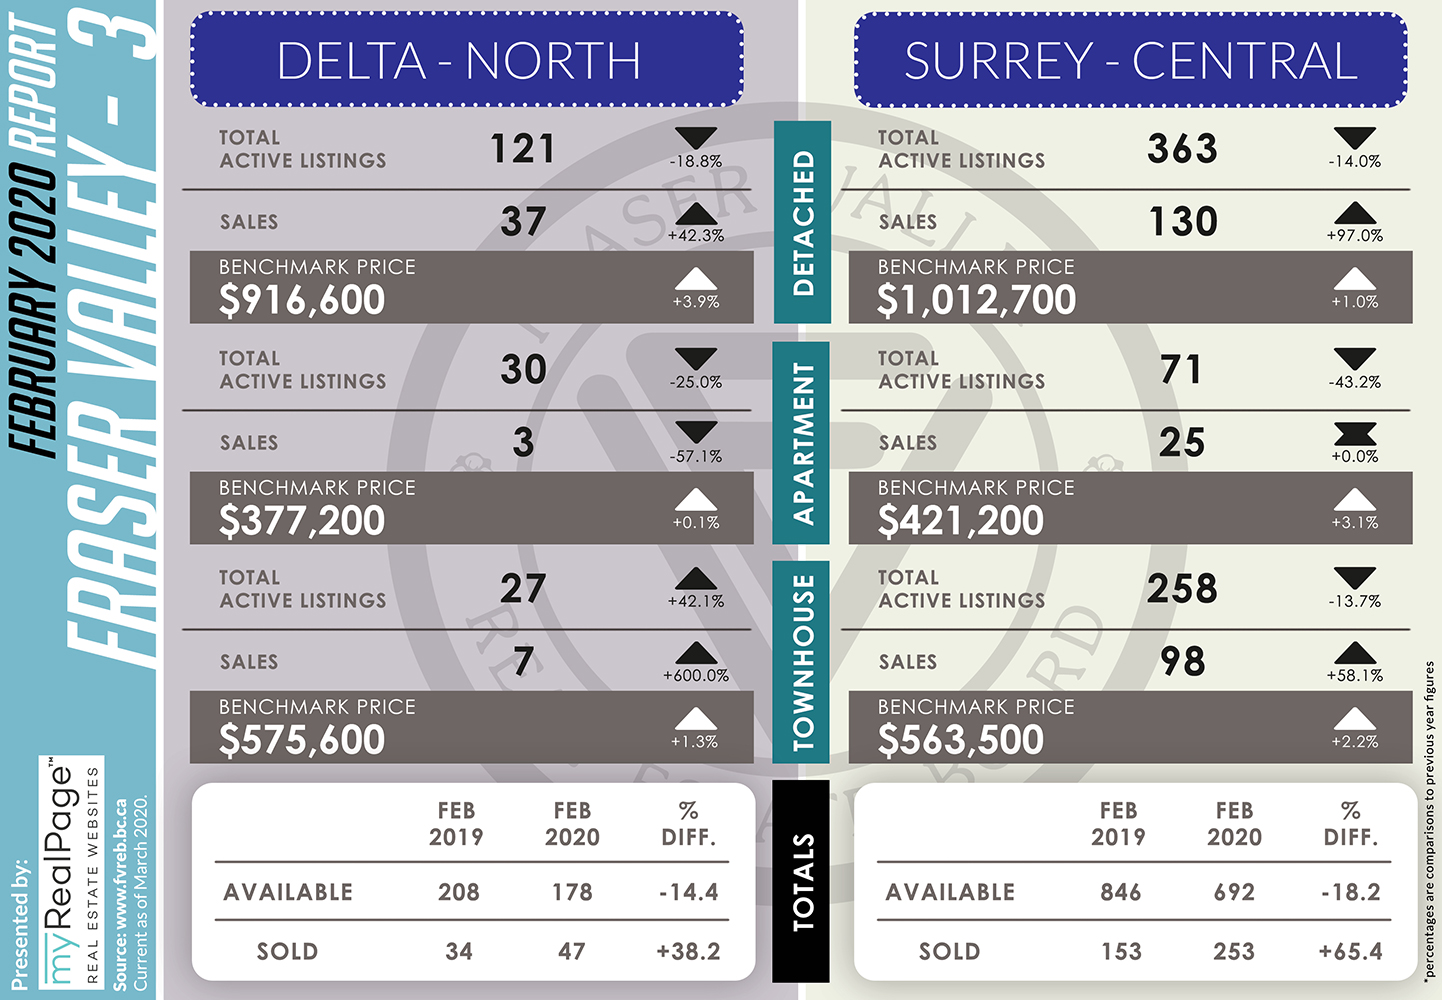
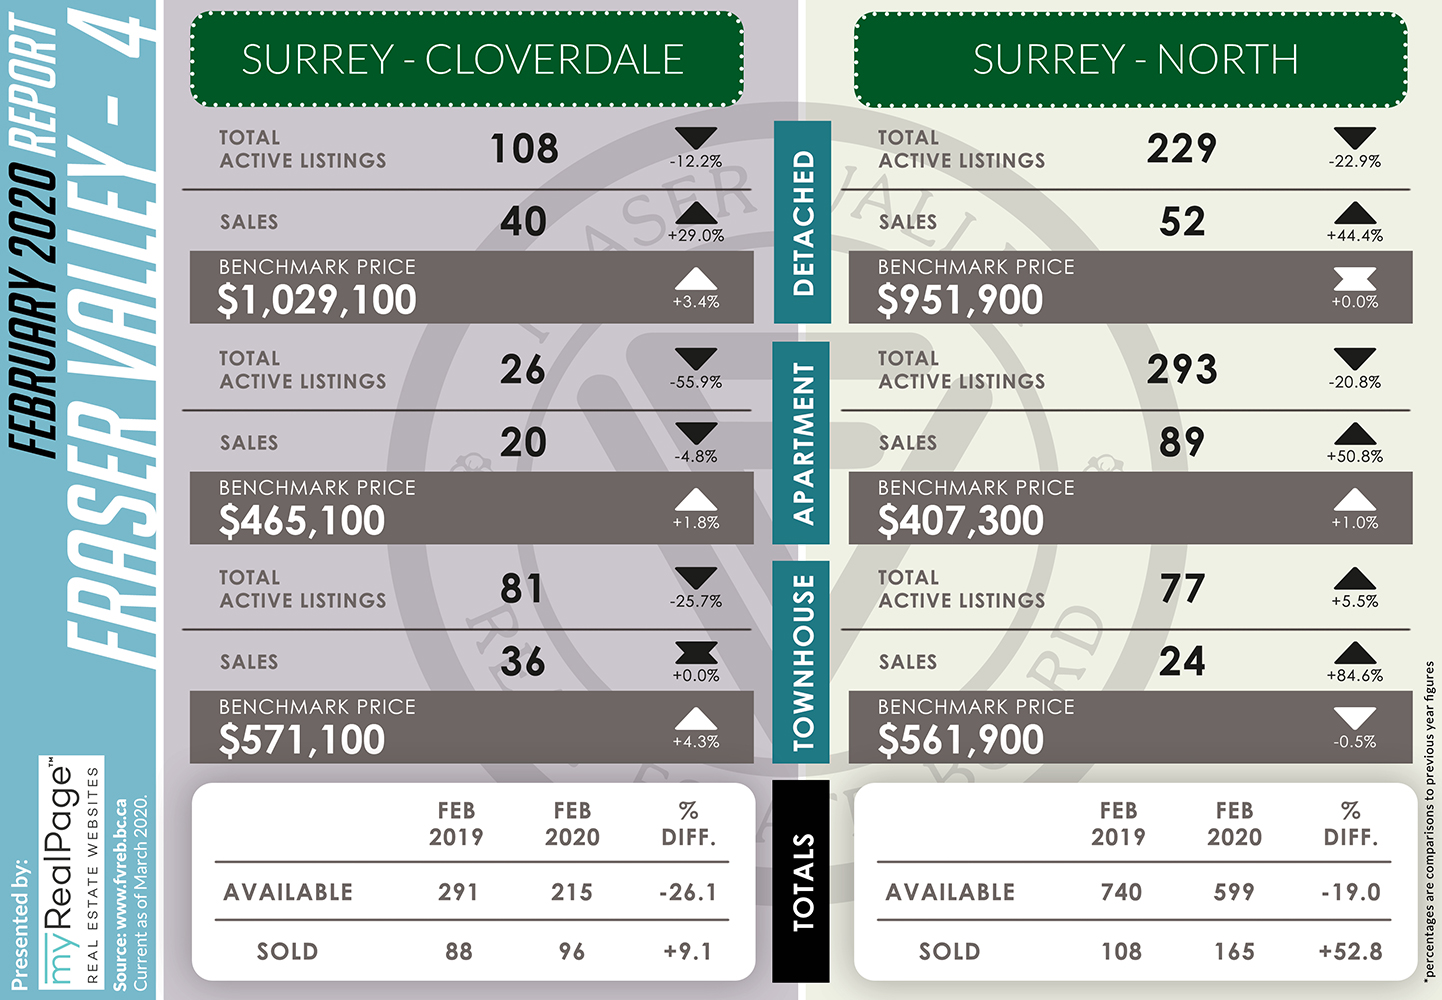
“Supply is a challenge currently in some areas and for certain property types. In February, in Langley for example, for every 10 active townhomes, six sold. In Cloverdale, there were 26 active condo listings last month; and 20 sold.
We are seeing more traffic at open houses, more multiple offers and a slight increase in year-over-year prices, so if you’ve been thinking about selling, talk to your local REALTOR® to find out if it’s the right time for you,” observed Germyn. “Another indicator we look at is how long it takes to sell a home and in February, the three main residential property types sold on average six days faster than last year.”
The following data is a comparison between February 2019 and February 2020 numbers, and is current as of March 2020. For last month’s report, check out our previous infographic!
Or follow this link for all our FVREB Infographics!
These infographics cover current trends in Fraser Valley neighbourhoods that are within the FVREB.
For this month, FVREB has also released their 2019 Special Housing Report, which you can download below!
Click on the images for a larger view!
(Protip: Make sure to grab the printable PDF version, too! It fits best when printed on A4-sized sheets, AND we’ve added an area on the sheet where you can attach your business card! 🙂 )
Download Printable Version – FVREB February 2020 Market Report
Download FVREB Special Housing Report 2019
Last Updated on July 25, 2022 by myRealPage
