INFOGRAPHICS: January 2020 FVREB Fraser Valley, South Surrey, Etc. Market Reports

Here are this month’s market updates for the Fraser Valley Real Estate Board (FVREB)!
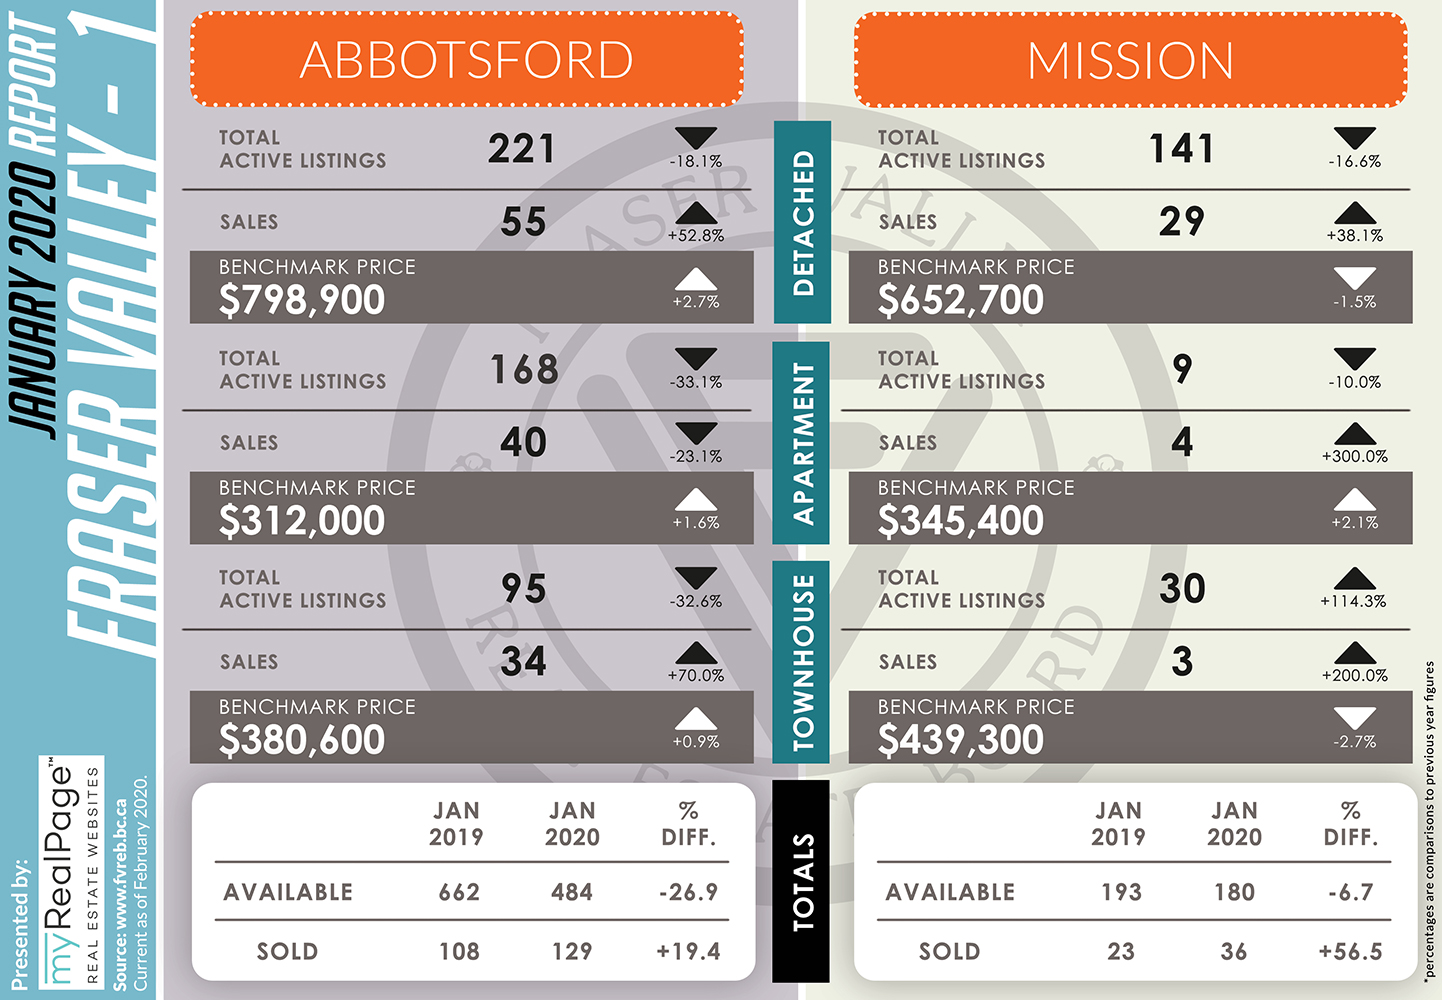
According to FVREB’s latest market report, January’s property sales in the Fraser Valley came in 6% above the 10-year average for the month, while new listings finished 11% below historical norms.
The Fraser Valley Real Estate Board processed 974 sales of all property types on its Multiple Listing Service® (MLS®) in January, a 21.9% decrease compared to sales in December 2019, and a 24.2% increase compared to the 784 sales in January of last year.
Of the 974 total MLS® sales of residential and commercial combined in the Fraser Valley, 363 were single family detached homes, 241 were townhouses, and 248 were apartments.
There were 5,143 active listings available in the Fraser Valley at the end of January, an increase of 9.8% compared to December 2019’s inventory and a decrease of 14.2% year-over-year.
Additionally, 2,216 new listings were received by the Board for the month, a significant increase compared to December 2019’s intake of 948 new listings and a 15.1% decrease compared year-over-year.
For the Fraser Valley region, the average number of days to sell an apartment in January was 49, and 47 for townhomes. Single family detached homes remained on the market for an average of 60 days before selling.
As noted by Darin Germyn, President of the Board,
“Considering our record-shattering snow and cold, the pace of home sales remained surprisingly balanced in January. Sales in our region have steadily improved since July of last year and January’s numbers remained consistent with that trend.
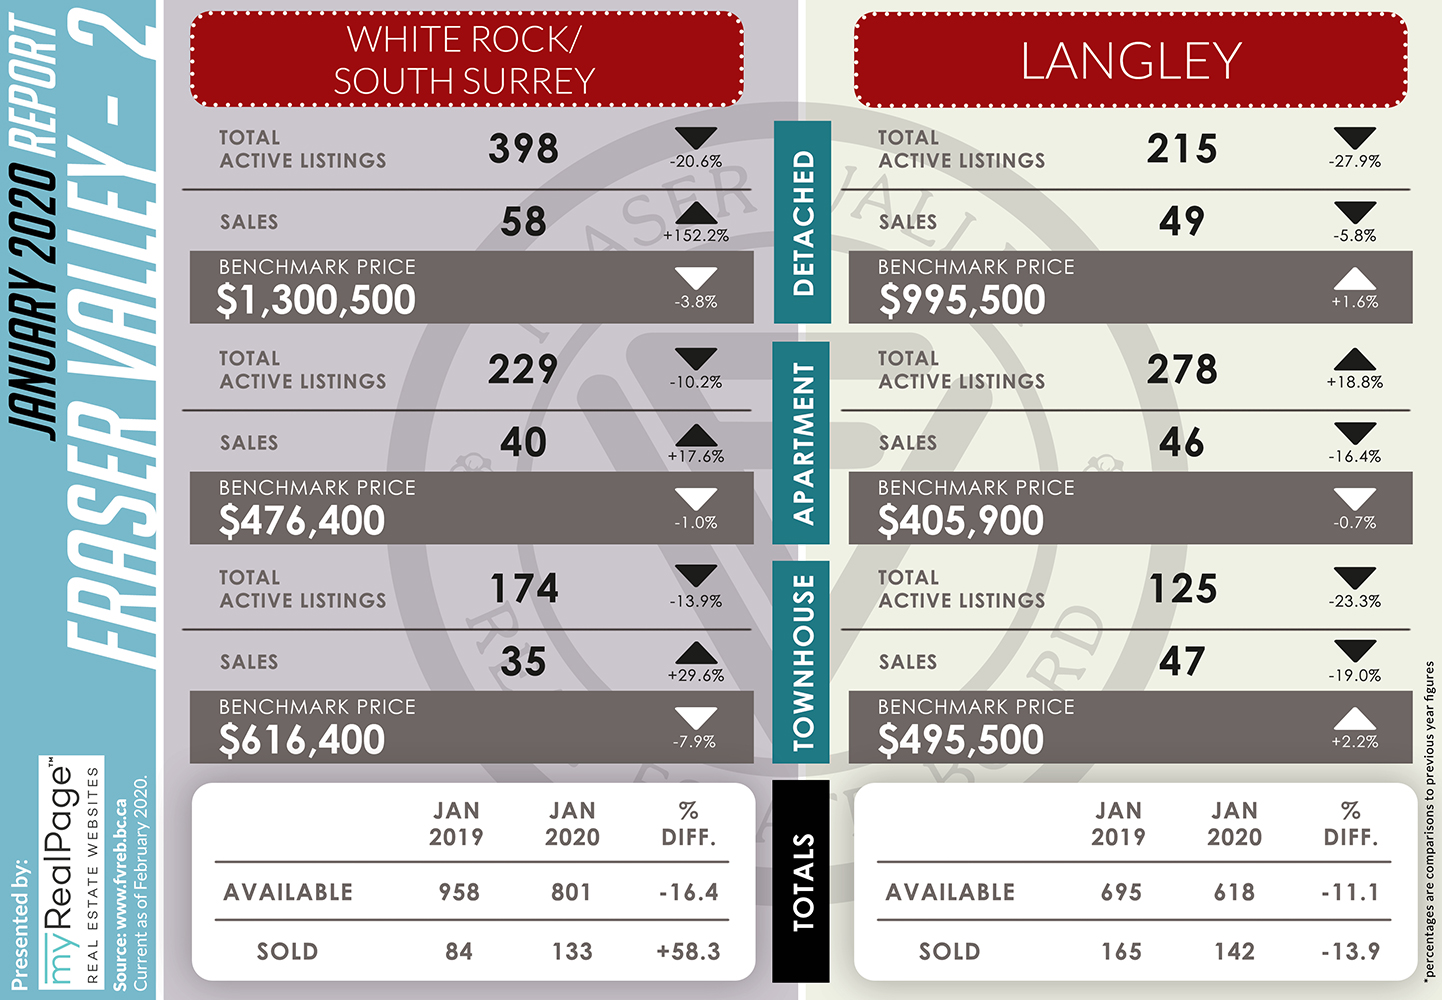
Where the weather may have had an impact in January, is on our housing supply. For certain property types, listings in the Fraser Valley are not keeping pace with sales. In areas of Surrey and Langley for example, for every two townhomes listed, one is selling. So, if you’re thinking of buying, talk to your REALTOR® about local market conditions to understand the variances.”
The following data is a comparison between January 2019 and January 2020 numbers, and is current as of February 2020. For last month’s report, check out our previous infographic!
Or follow this link for all our FVREB Infographics!
These infographics cover current trends in Fraser Valley neighbourhoods that are within the FVREB.
Click on the images for a larger view!
(Protip: Make sure to grab the printable PDF version, too! It fits best when printed on A4-sized sheets, AND we’ve added an area on the sheet where you can attach your business card! 🙂 )
Download Printable Version – FVREB January 2020 Market Report
Last Updated on July 25, 2022 by myRealPage
