INFOGRAPHICS: February 2021 VIREB Vancouver Island Market Reports

Buyer Demand Continues to Outstrip Supply
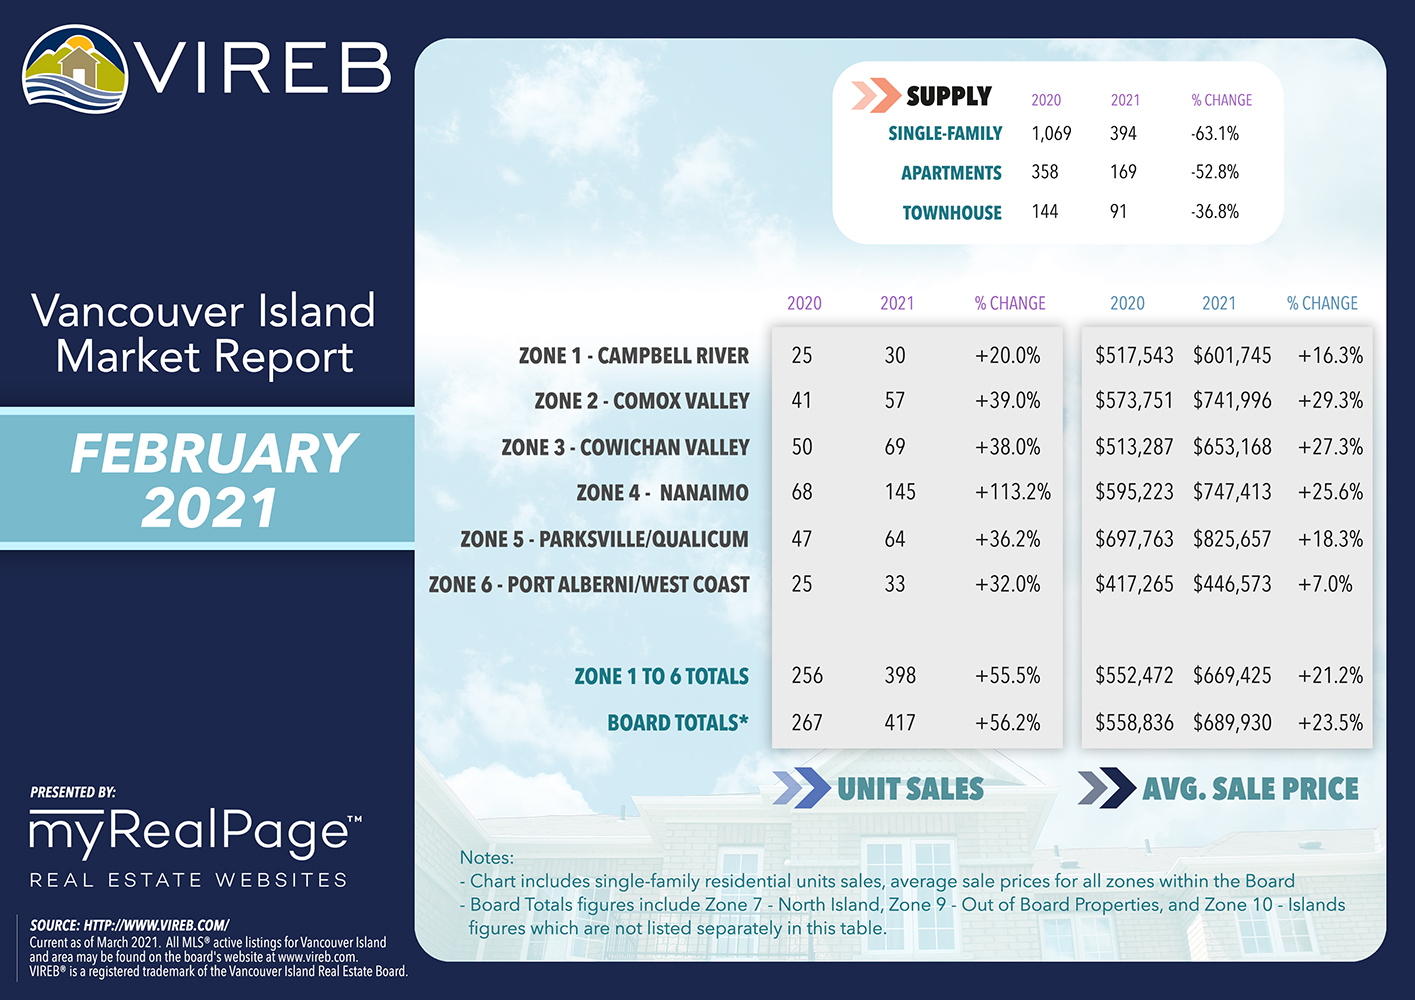
Buyer demand in the VIREB area continues to outstrip supply, contributing to the lowest inventory on record for the board.
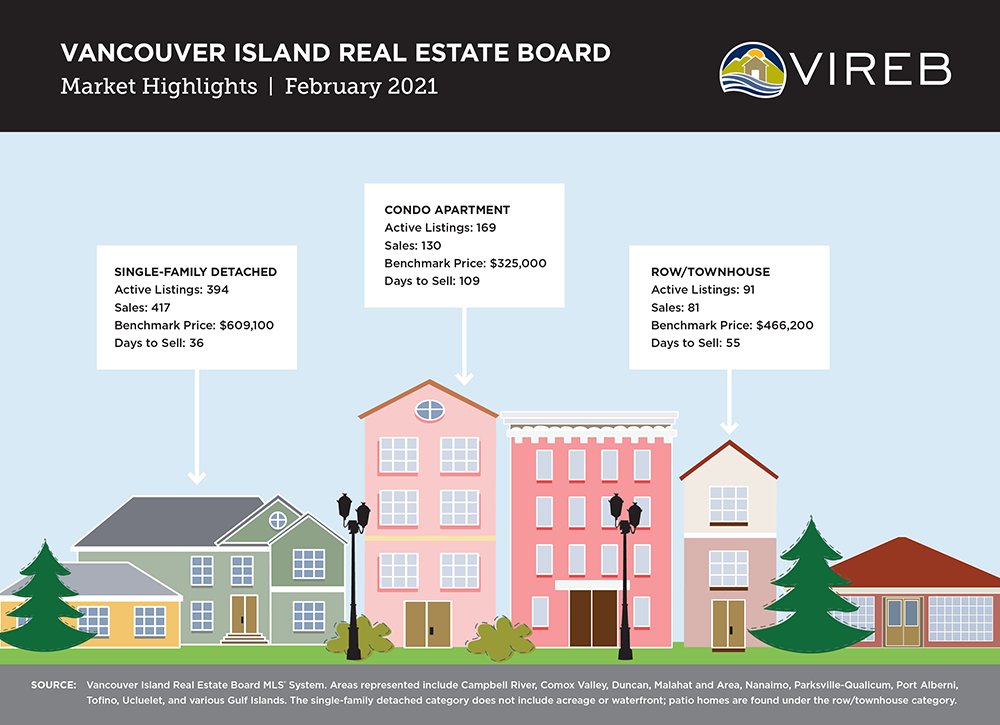
Active listings of single-family detached properties (excluding acreage and waterfront) dropped to 394 in February, down six per cent from January. There were 169 condo apartments for sale last month compared to 212 in January, a drop of 20 per cent. Month-over-month townhouse inventory decreased slightly, with 91 units for sale in February compared to 95 the previous month.
Read the full report on the VIREB website!
The following data is a comparison between February2020 and February 2021 numbers, and is current as of March 2021. Click here to check out last month’s infographics.
You can also view all our VIREB infographics by clicking here.
Click on the images for a larger view! (Protip: Make sure to grab the printable PDF versions, too! It fits best when printed on A4-sized sheets, AND we’ve added an area on the sheet where you can attach your business card! 🙂 )
Download Printable Version – February 2021 VIREB Market Report
-

- (from VIREB Twitter)
Last Updated on July 25, 2022 by myRealPage
