INFOGRAPHICS: February 2023 CREB City And Region Market Reports

Lowest February inventory since 2006
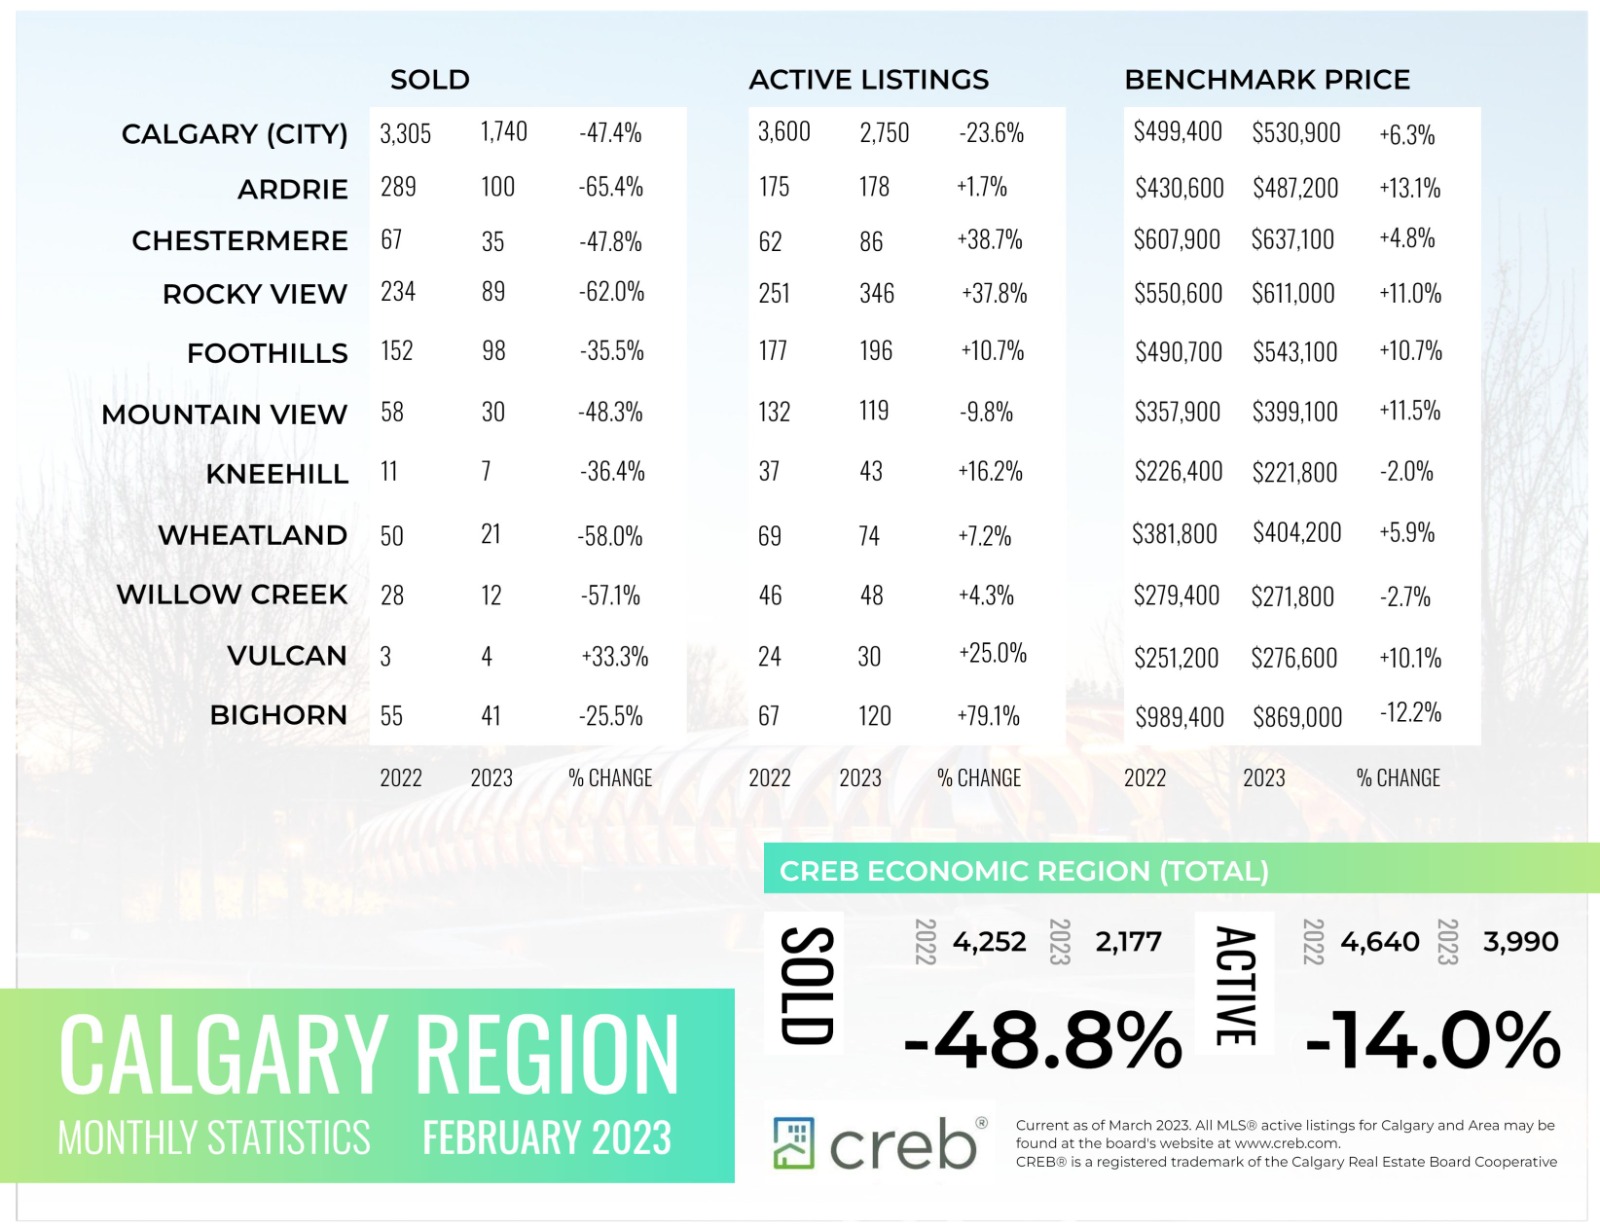
Consistent with typical seasonal behavior sales, new listings and inventory levels all trended up compared to last month. However, with 1,740 sales and 2,389 new listings, inventory levels improved only slightly over the last month and remained amongst the lowest February levels seen since 2006.
“While higher lending rates are impacting sales activity as expected, we are seeing a stronger pullback in new listings, keeping supply levels low and supporting some stronger-than-expected monthly price gains,” said CREB® Chief Economist Ann- Marie Lurie. “Prices are still below the May 2022 peak and it is still early in the year. However, if we do not see a shift in supply, we could see further upward pressure on prices over the near term.”
Both sales and new listings declined over last year’s record high for the month. While sales activity remained stronger than long-term trends and levels reported throughout the 2015 to 2020 period, new listings fell below long-term trends. With a sales-to-new-listings ratio of 73 per cent and a months of supply of under two months, the market has struggled to move into balanced territory causing further upward pressure on home prices. The unadjusted benchmark price increased by nearly two per cent over January levels and last year’s prices.
Read the full report on the CREB website!
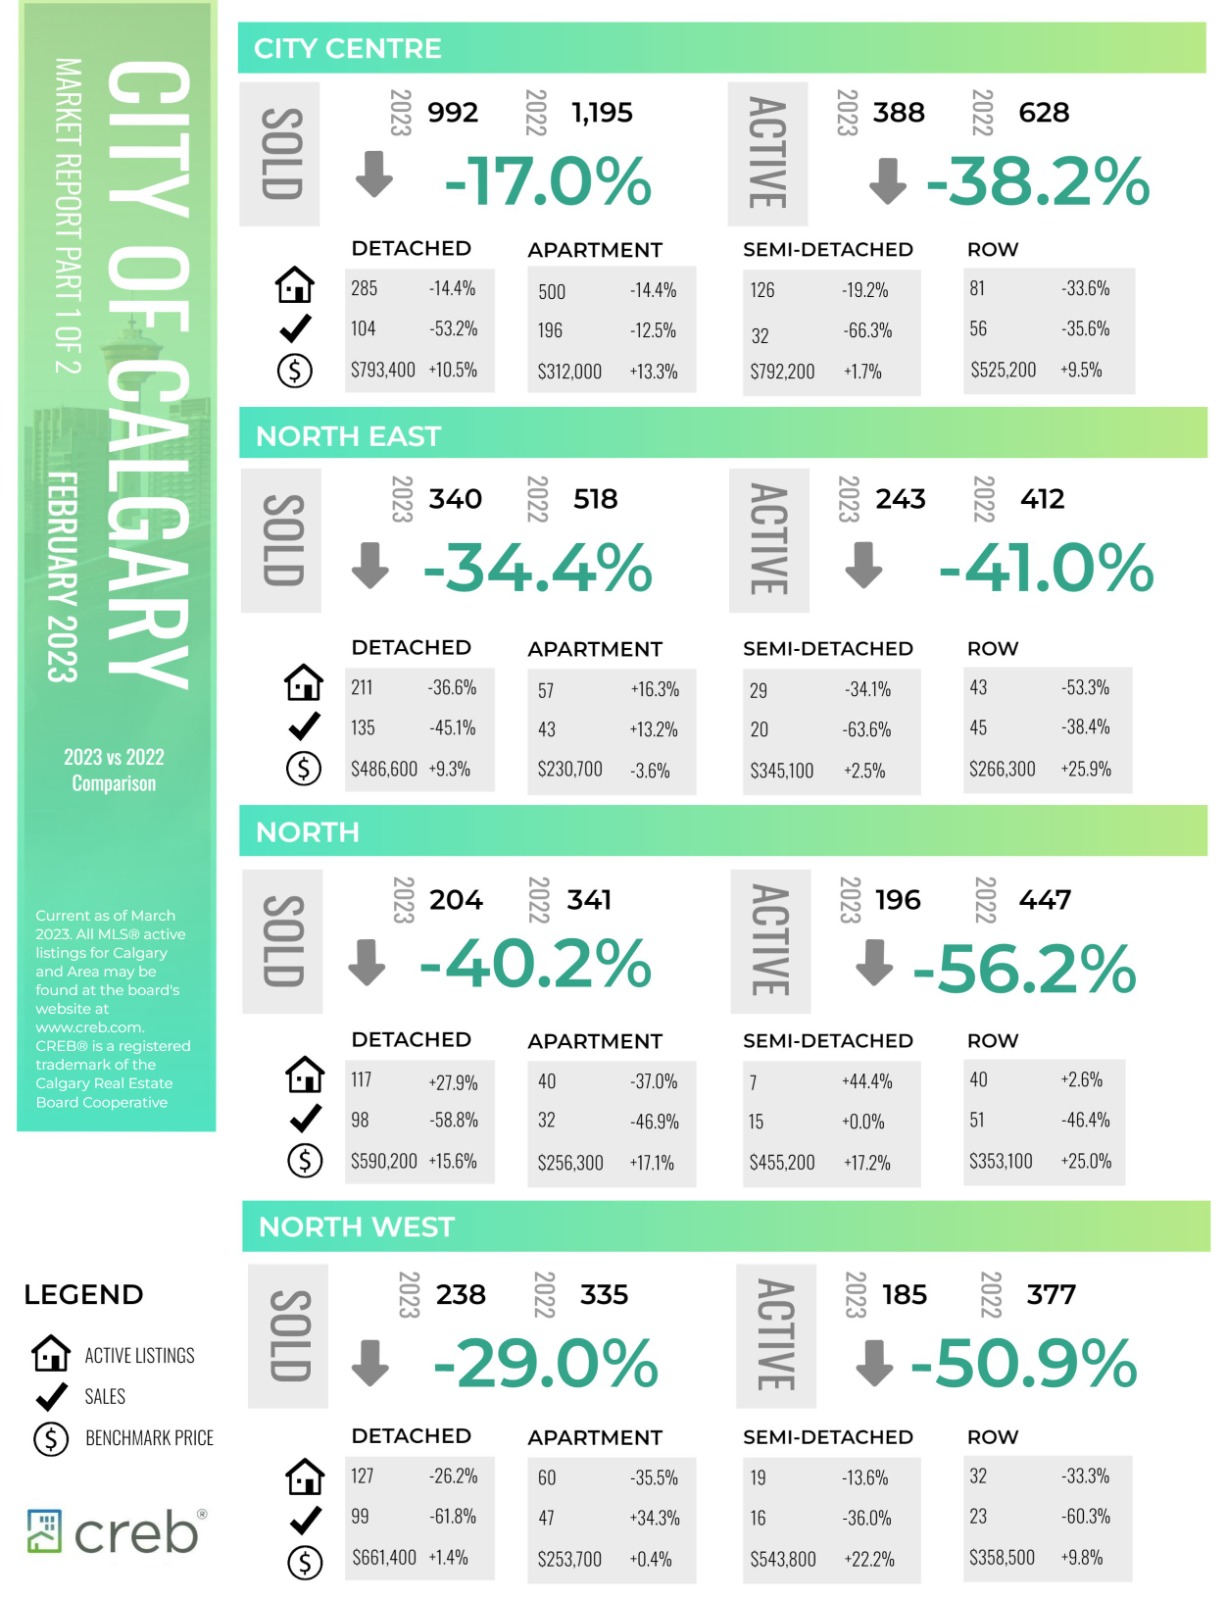
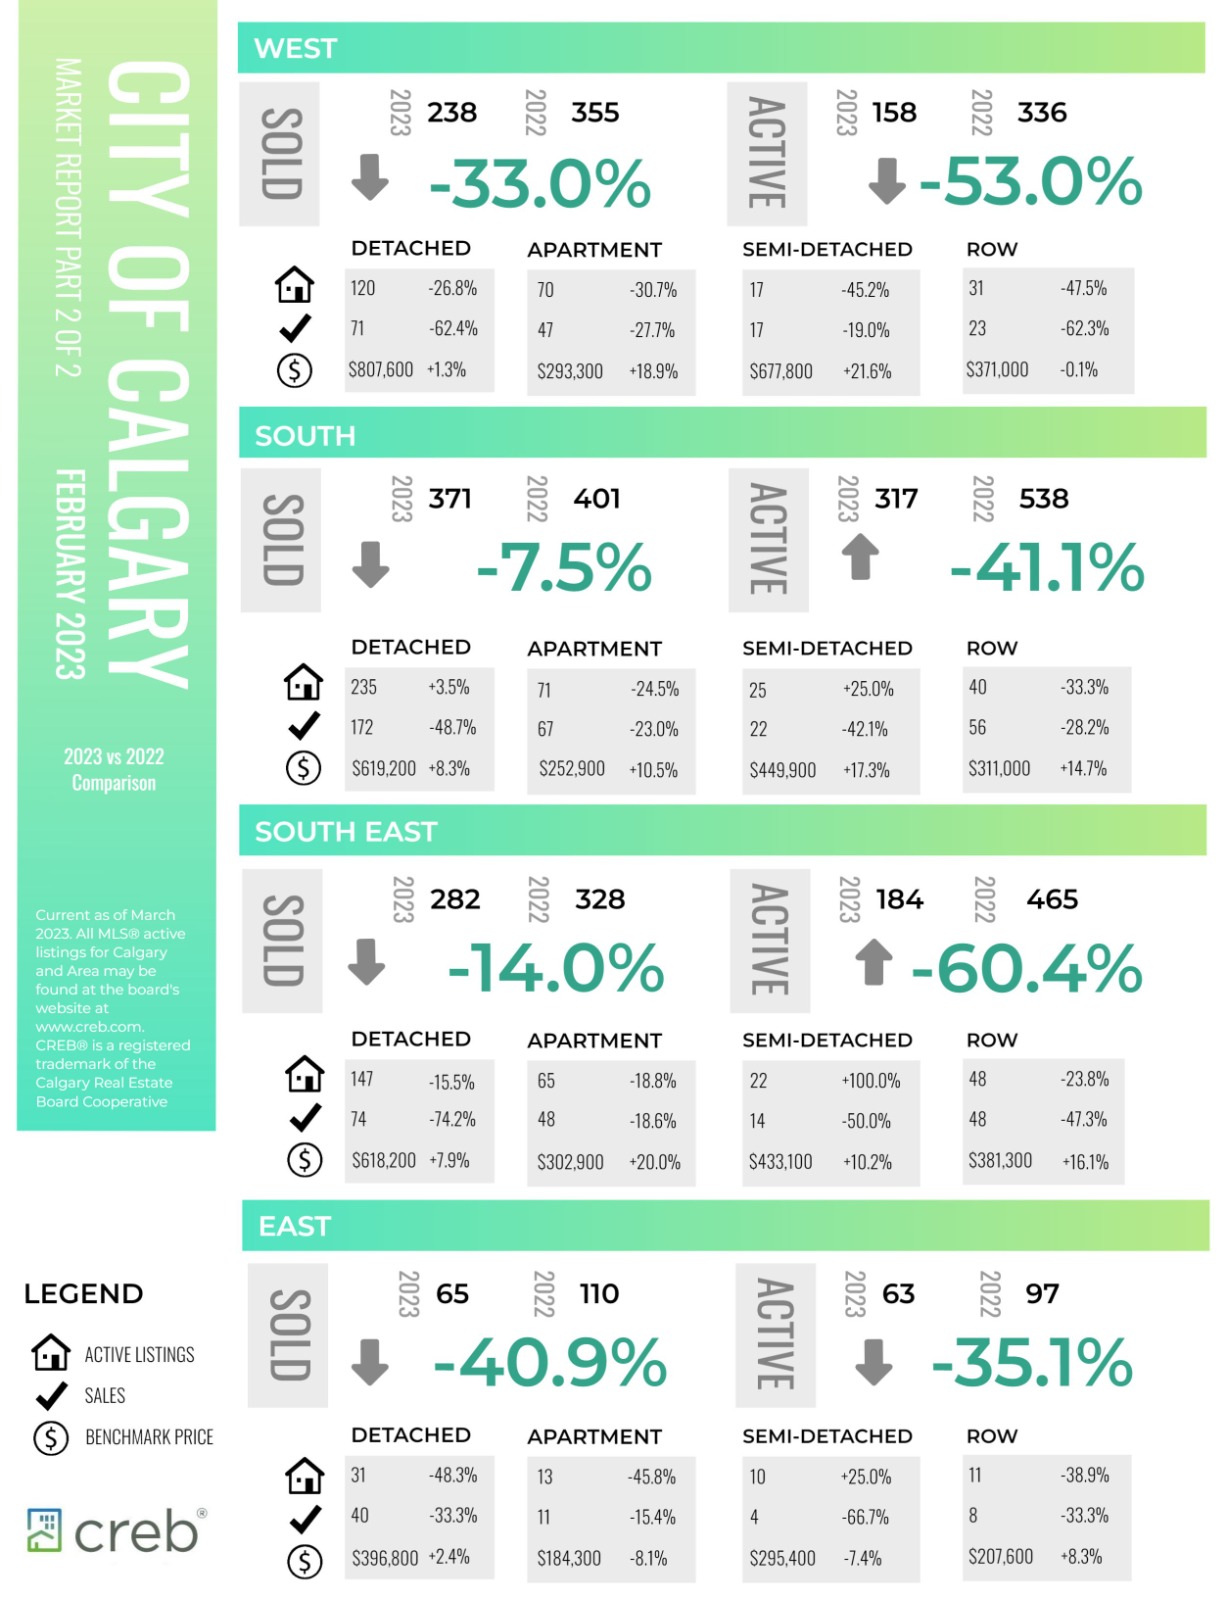
The following data is a comparison between February 2023 and February 2022 numbers, and is current as of March 2023. For last month’s numbers, check out our previous infographic.
Or follow this link for all our CREB Infographics!
Click on the images for a larger view!
Download Printable Version – February 2023 CREB, City of Calgary Report Part 1
Download Printable Version – February 2023 CREB, City of Calgary Report Part 2
Download Printable Version – February 2023 CREB, Calgary Region Report
Last Updated on November 28, 2023 by myRealPage
