INFOGRAPHICS: January 2020 TRREB / TREB Toronto Market Reports

NOTE: The Toronto Real Estate Board (TREB) has recently rebranded, and is now known as the Toronto Regional Real Estate Board (TRREB). For more information, please refer to the official announcement on TRREB.ca.
Here are the latest real estate market updates for areas covered by the Toronto Regional Real Estate Board (TRREB, formerly TREB)!
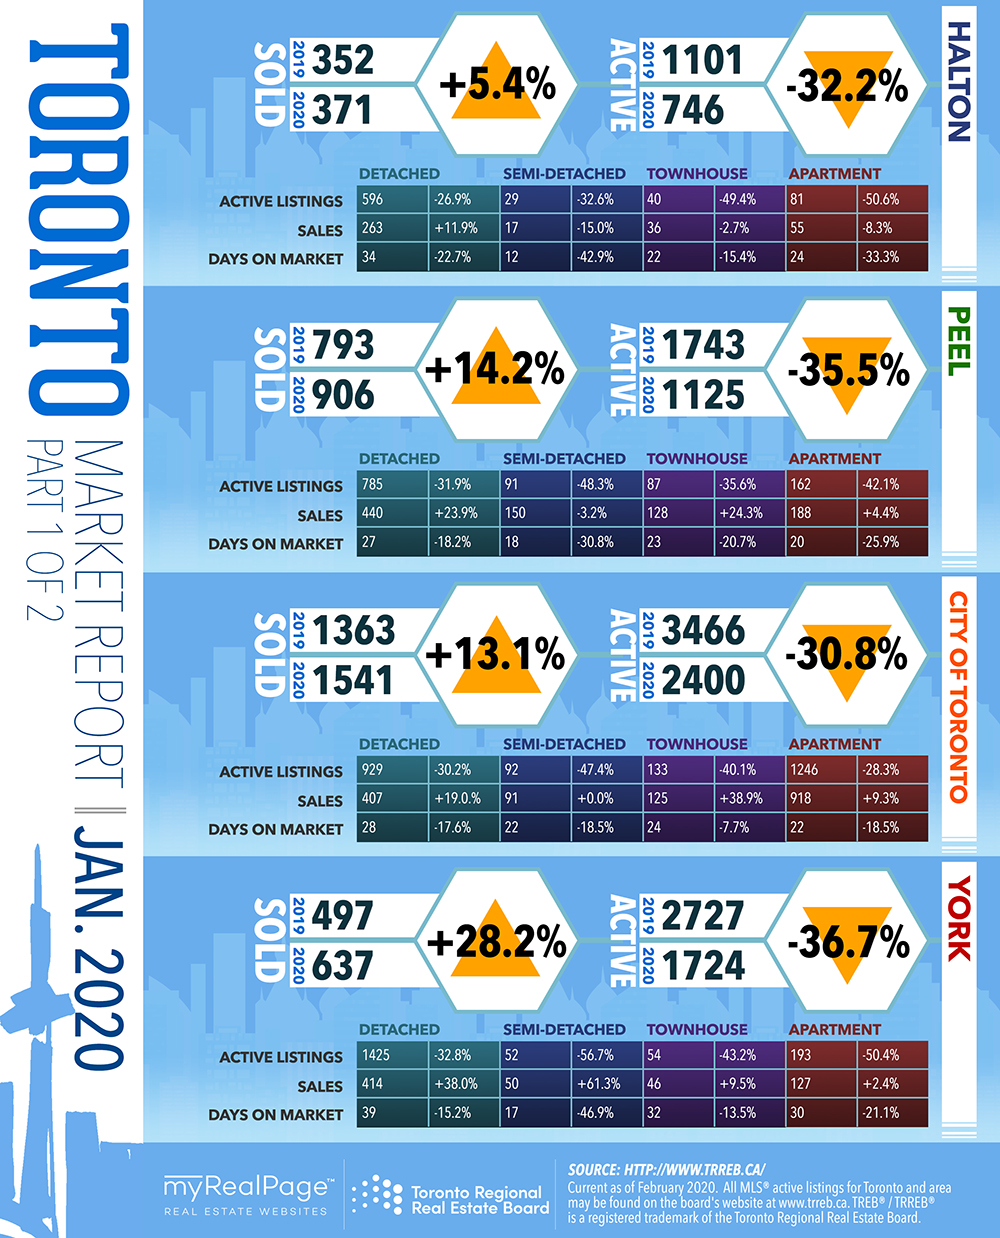
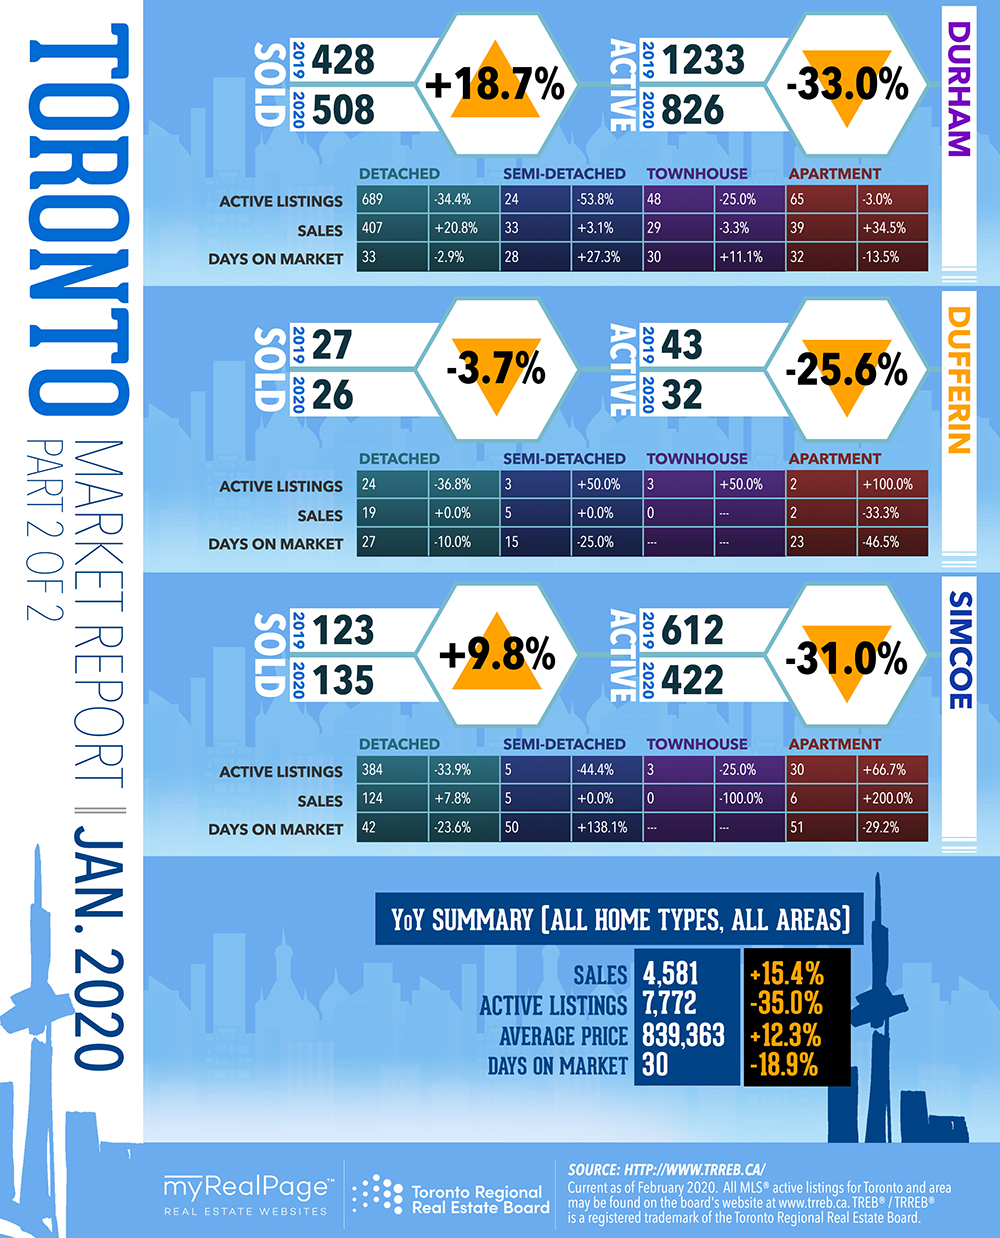
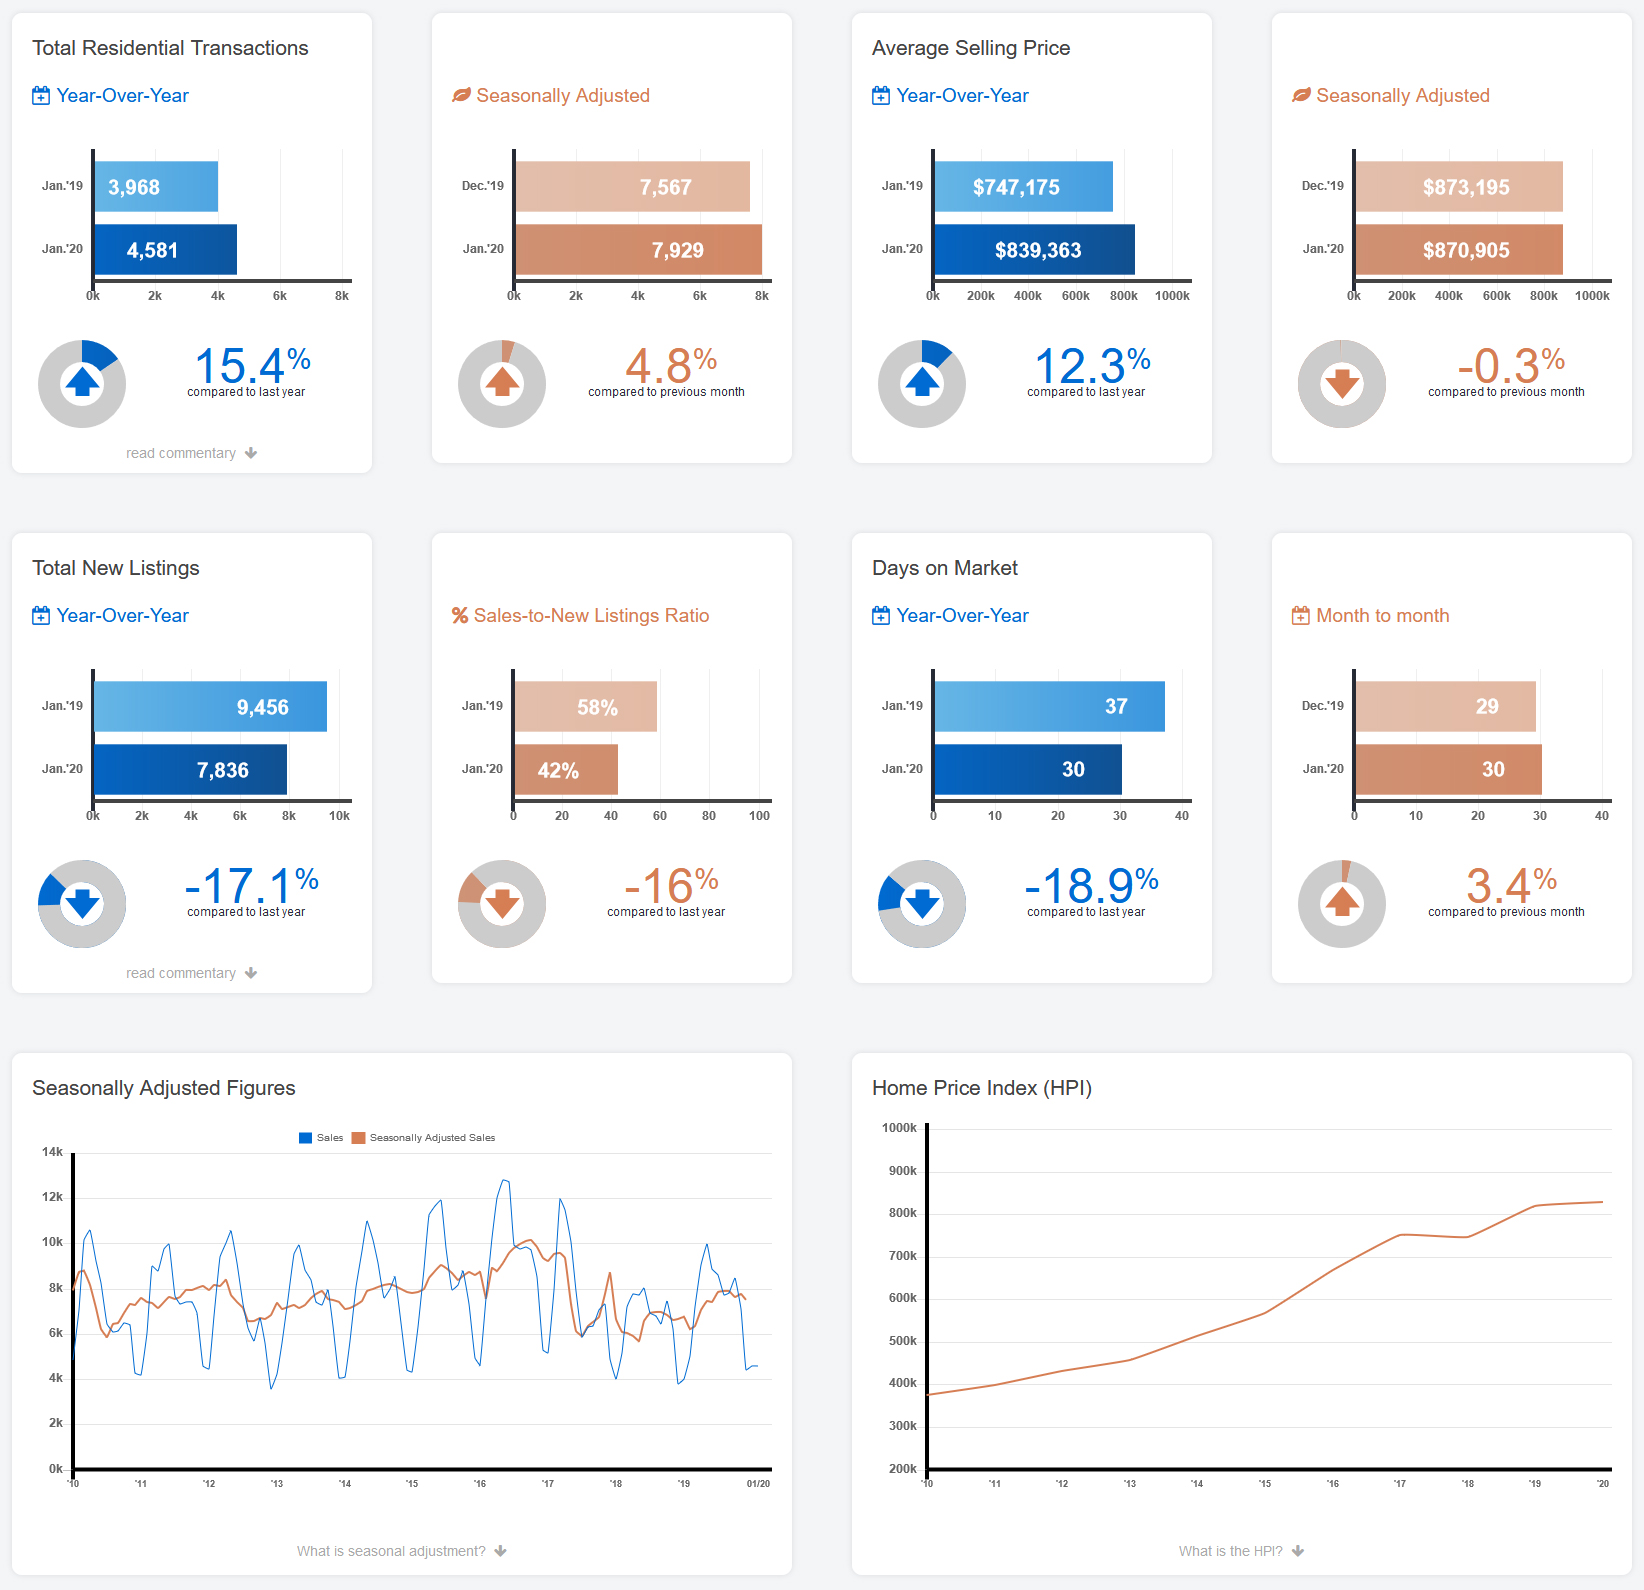
In their most recent market update, TRREB President Michael Collins announced that Greater Toronto Area REALTORS® reported 4,581 home sales through TRREB’s MLS® System in January 2020 – up by 15.4% compared to January 2019. On a preliminary seasonally adjusted basis, sales were up by 4.8% compared to December 2019. Collins notes,
“We started 2020 where 2019 left off, with very strong growth in the number of sales up against a continued dip in the number of new and available listings. Tighter market conditions compared to a year ago resulted in much stronger growth in average selling prices. Steady population growth, low unemployment and low borrowing costs continued to underpin substantial competition between buyers in all major market segments.”
The MLS® HPI Composite Benchmark price was up by 8.7% compared to January 2019 – the highest annual rate of growth for the Benchmark since October 2017. The condominium apartment market segment continued to lead the way in terms of MLS HPI® price growth, but all home types experienced price growth above 7% when considering the TRREB market area as a whole. The average selling price in January was up by 12.3%, driven by the detached and condominium apartment segments in the City of Toronto.
Jason Mercer, TRREB’s Director of Market Analysis and Service Channels also remarked,
“A key difference in the price growth story in January 2020 compared to January 2019 was in the low-rise market segments, particularly with regard to detached houses. A year seems to have made a big difference. It is clear that many buyers who were on the sidelines due to the OSFI stress test are moving back into the market, driving very strong year-over-year sales growth in the detached segment. Strong sales up against a constrained supply continues to result in an accelerating rate of price growth.”
The following data is a comparison between January 2019 and January 2020 numbers, and is current as of February 2020. For last month’s numbers, check out our previous infographic!
Or follow this link for all our TREB / TRREB Infographics!
For this month, TRREB has also released their fifth annual Market Year in Review and Outlook Report which you can also download below!
Click on the images for a larger view!
(Protip: Make sure to grab the printable PDF versions, too! It fits best when printed on A4-sized sheets, AND we’ve added an area on the sheet where you can attach your business card! 🙂 )
Download Printable Version – January 2020 TRREB, Toronto Market Report
Download 2020 TRREB Market Year in Review and Outlook Report
(Image Source: TRREB.ca)
Last Updated on July 25, 2022 by myRealPage
