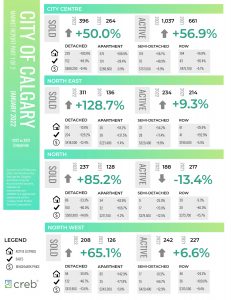
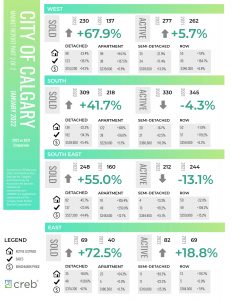
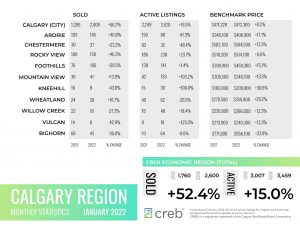
INFOGRAPHICS: January 2022 CREB City And Region Market Reports

Sellers’ market conditions continue to impact prices
Thanks to persistently strong sales, inventory levels in the city eased to 2,620 units, the lowest levels seen since 2006. This caused the months of supply to remain exceptionally low for this time of year at 1.3 months.
The tight market conditions contributed to further upward pressure on prices. The unadjusted benchmark price in January reached $472,300, a monthly gain of nearly two per cent and a year-over-year gain of 12 per cent.
“Expected gains in lending rates are contributing to persistently strong demand in the housing market, as purchasers are eager to get ahead of any increases,” said CREB® Chief Economist Ann-Marie Lurie.
Read the full report on the CREB website!
The following data is a comparison between January 2022 and January 2021 numbers, and is current as of February 2022. For last month’s numbers, check out our previous infographic.
Or follow this link for all our CREB Infographics!
Click on the images for a larger view!
Download Printable Version – January 2022 CREB, City of Calgary Report Part 1
Download Printable Version – January 2022 CREB, City of Calgary Report Part 2
Download Printable Version – January 2022 CREB, Calgary Region Report
Last Updated on July 25, 2022 by myRealPage


