INFOGRAPHICS: January 2022 FVREB Fraser Valley, South Surrey, Etc. Market Reports

Glimmer of hope for Fraser Valley home buyers as new listings surge in January
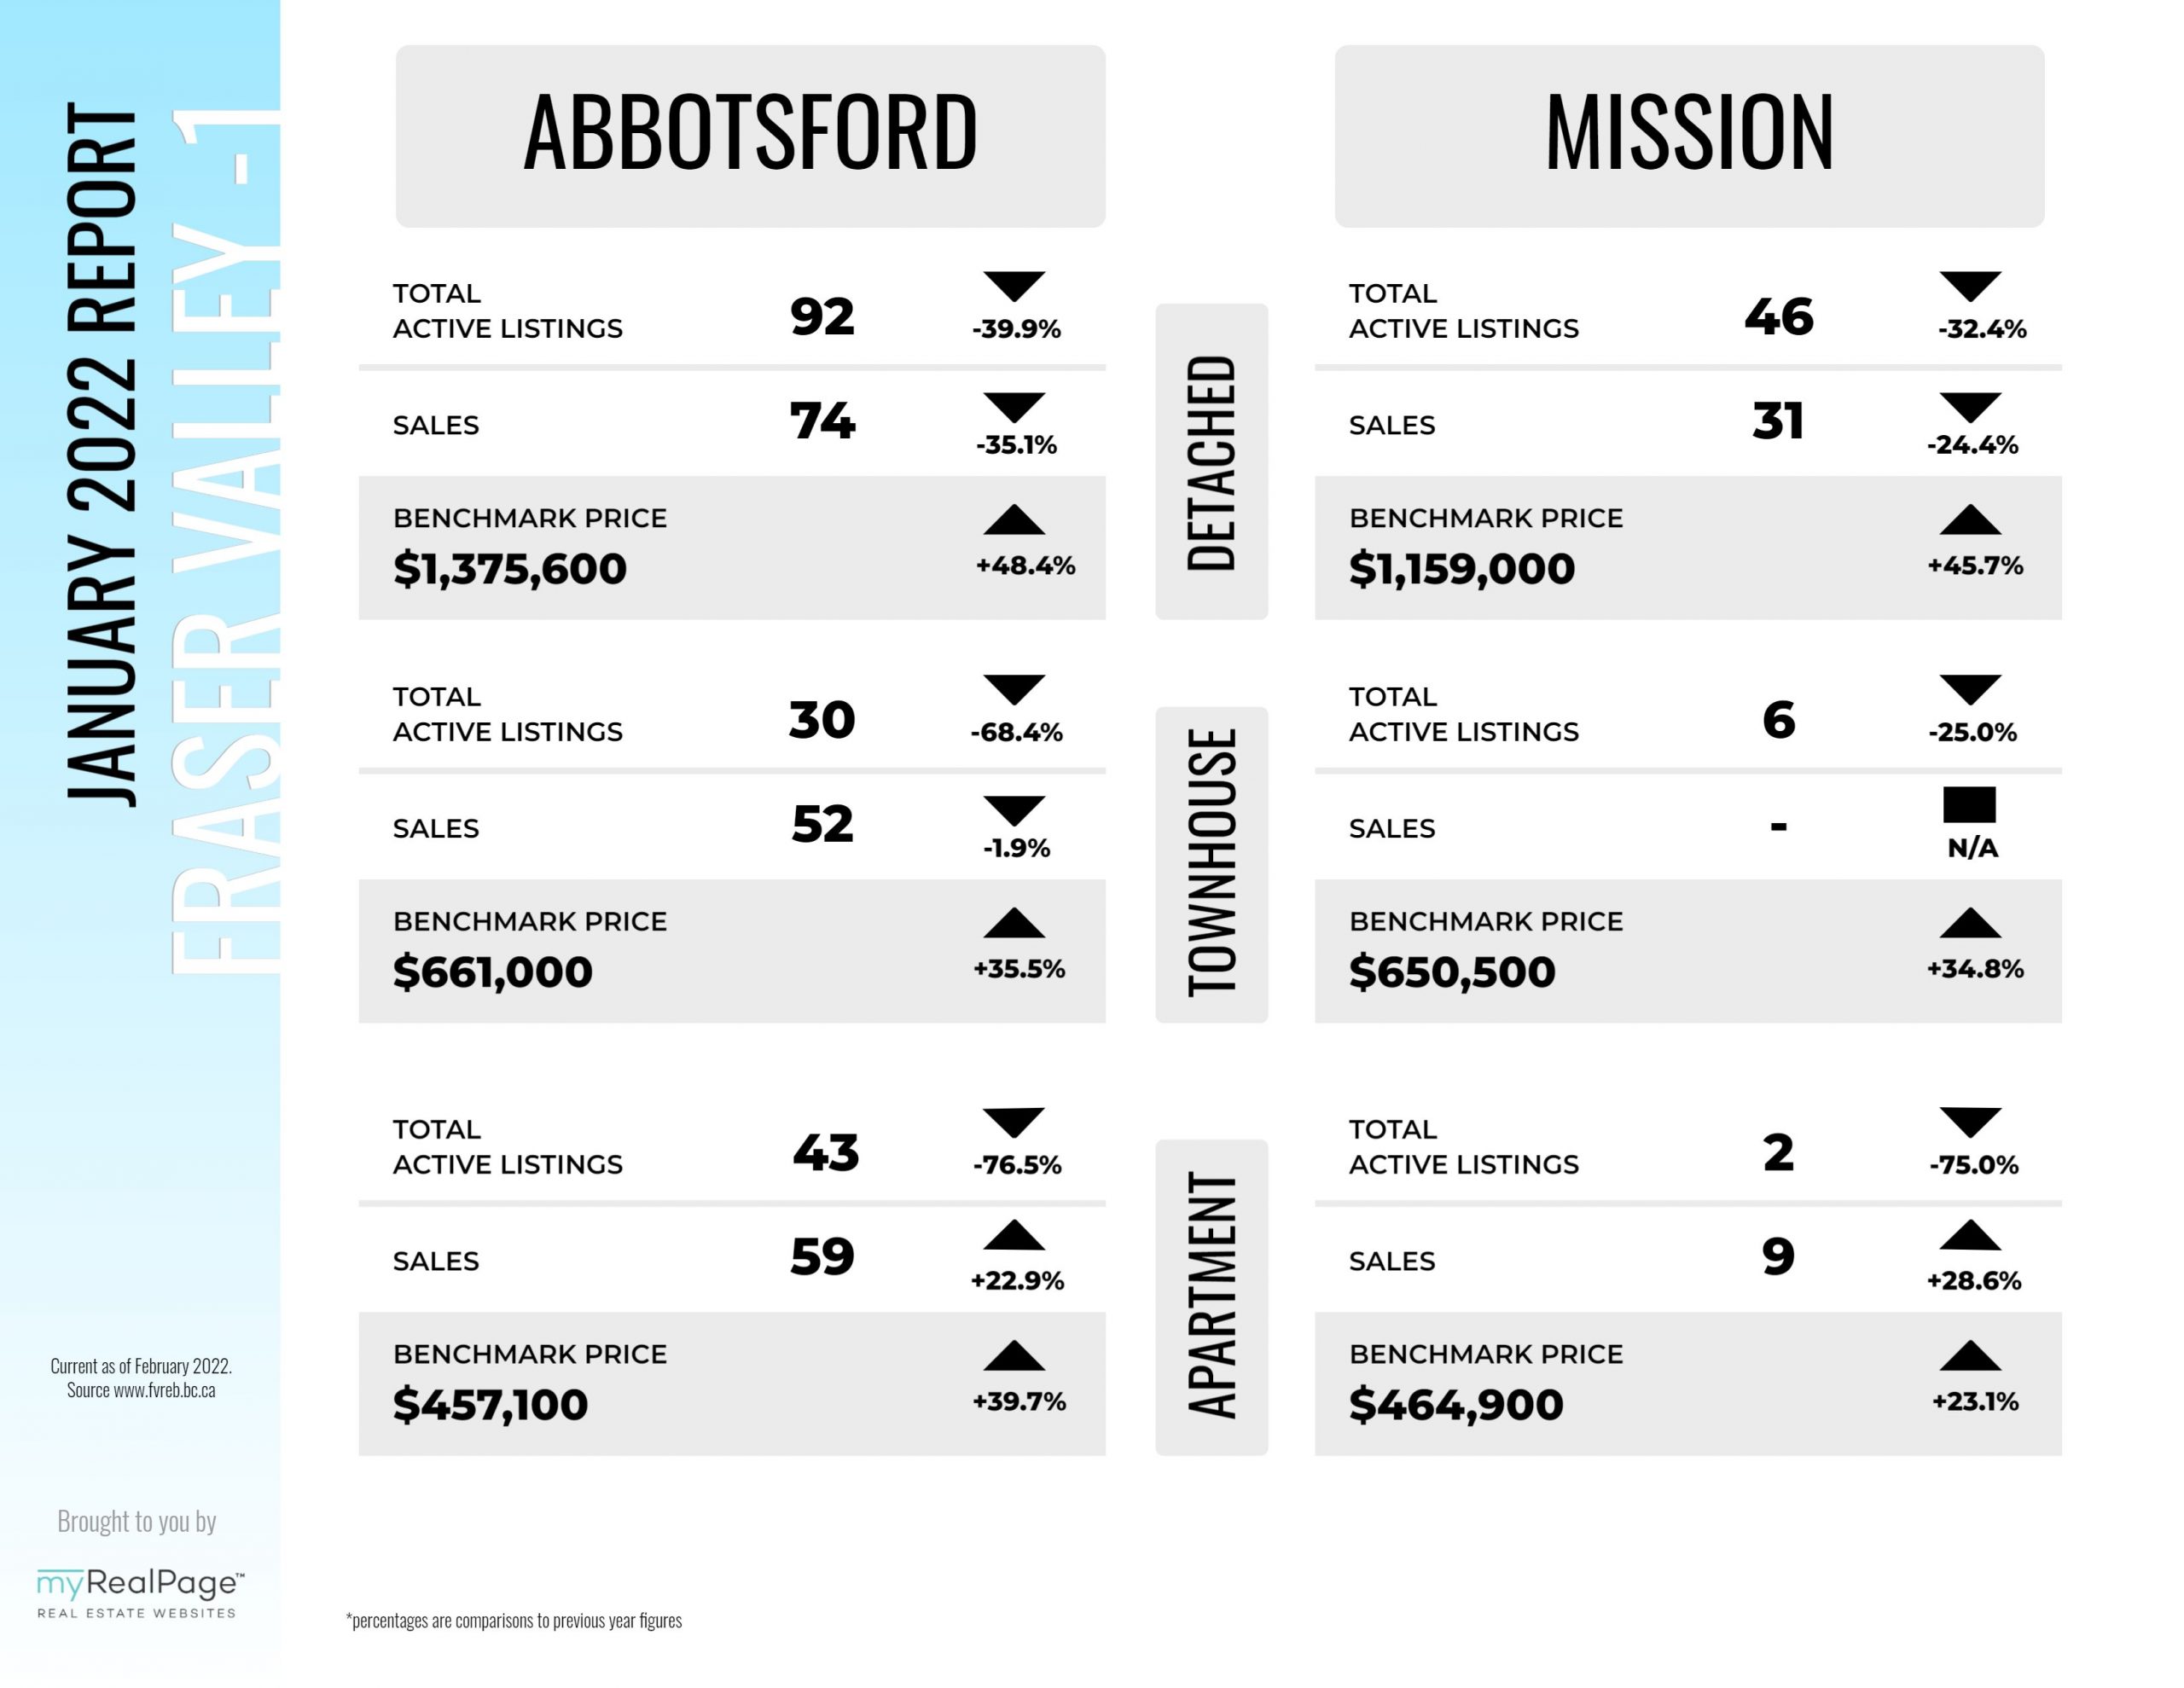
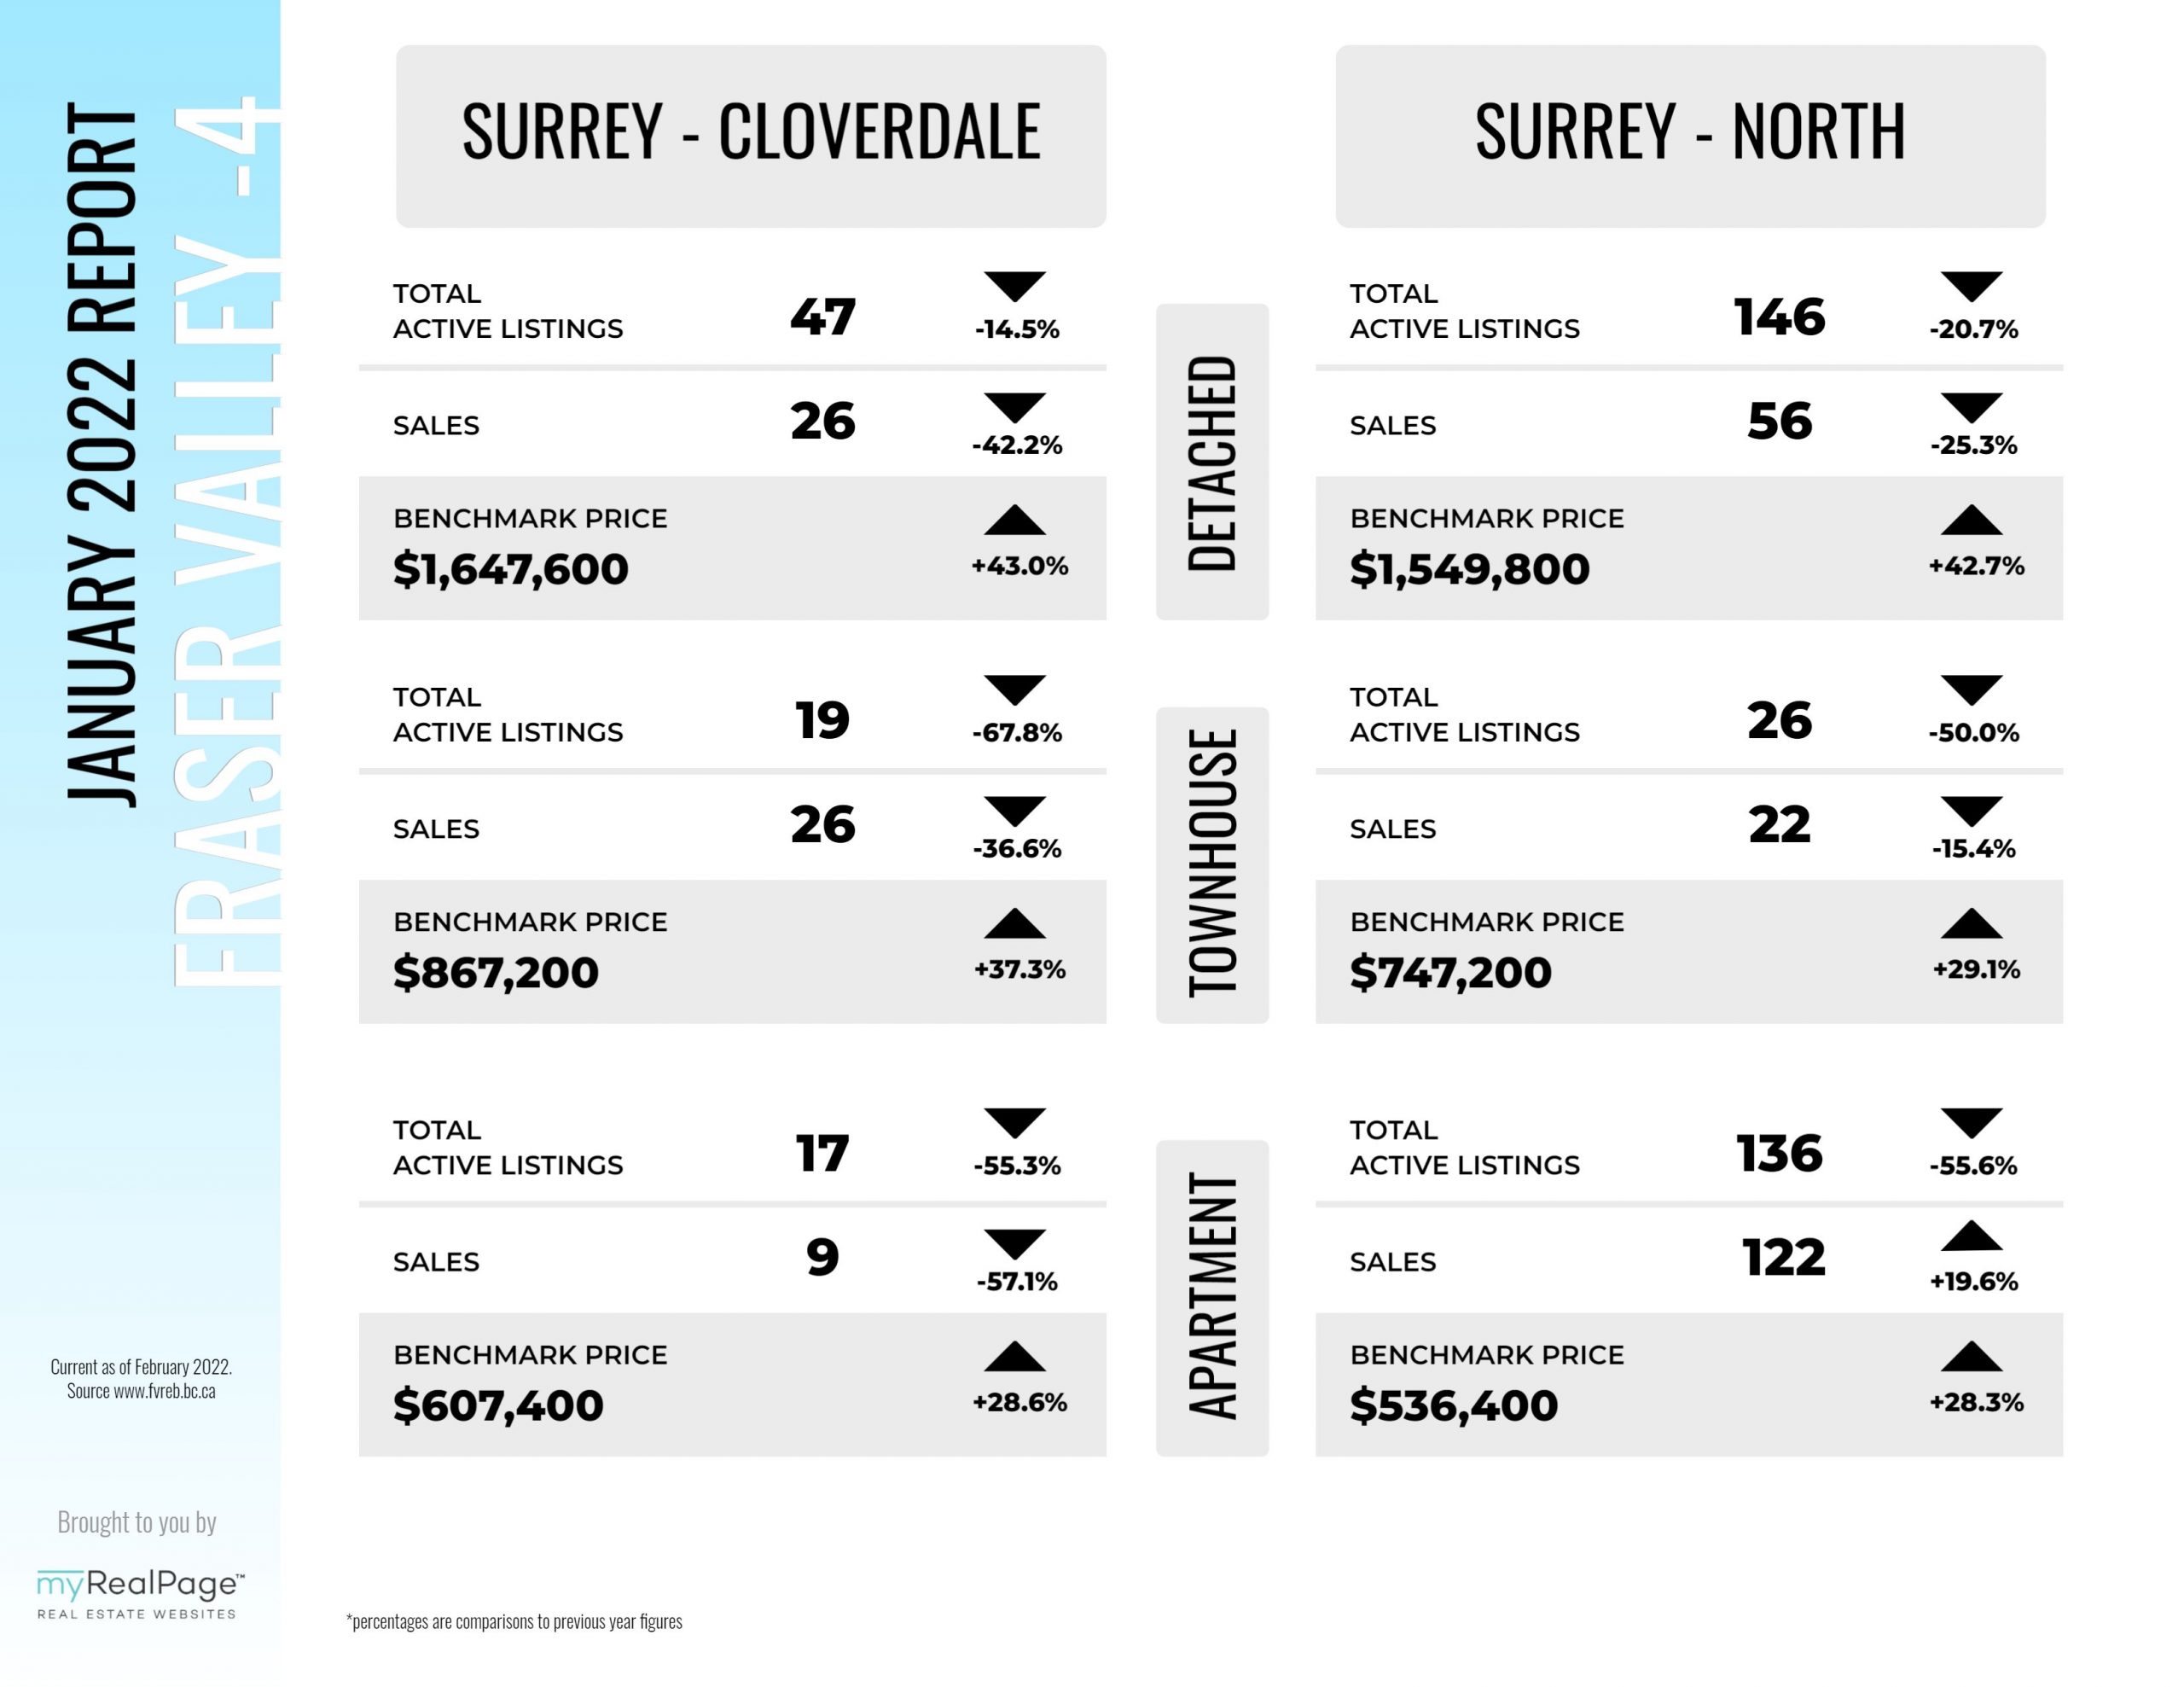
On the heels of the busiest year in history for Fraser Valley real estate, January activity saw the beginnings of a market rebalancing. Overall property sales – still the third highest ever for January – cooled compared to December while the volume of new listings improved significantly.
The Fraser Valley Real Estate Board processed a total of 1,310 sales of all property types on its Multiple Listing Service® (MLS®) in January 2022, a decrease of 23.7 per cent compared to January 2021, and 27.5 per cent lower compared to December 2021.
The Board received 2,135 new listings in January, an increase of 67.1 per cent compared to December 2021, and a decrease of 23.3 per cent compared to January of last year. Total active listings for the month were 2,332, down 44.6 per cent compared to January 2021, however an increase of 19.2 per cent compared to December 2021.
Read the full report on the FVREB website!
The following data is a comparison between January 2022 and January 2021 numbers, and is current as of February 2022. For last month’s report, check out our previous infographic!
Or follow this link for all our FVREB Infographics!
These infographics cover current trends in Fraser Valley neighbourhoods that are within the FVREB. Click on the images for a larger view!
Download Printable Version – FVREB January 2022 Market Report 1
Download Printable Version – FVREB January 2022 Market Report 2
Download Printable Version – FVREB January 2022 Market Report 3
Download Printable Version – FVREB January 2022 Market Report 4


Last Updated on July 25, 2022 by myRealPage
