INFOGRAPHICS: December 2021 FVREB Fraser Valley, South Surrey, Etc. Market Reports

Fraser Valley real estate market sees busiest year in 100‐year history
Fueled by the consumer response to the COVID‐19 pandemic along with historically low interest rates, total property sales in the Fraser Valley in 2021 shattered the previous annual record last set in 2016.
The FVREB processed 27,692 sales its Multiple Listing Service® (MLS®) in 2021, an increase of 39.0 per cent compared 19,926 sales in 2020; and 15.5 per cent higher than 2016’s 23,974 sales.
Larry Anderson, President of the Board, said, “No one could have predicted how the pandemic would impact the real estate market. Our region’s relative affordability, combined with a newfound ability to work from home and the value for housing dollar in the Fraser Valley attracted buyers in numbers like we’ve never seen.
Read the full report on the FVREB website!
The following data is a comparison between December 2020 and December 2021 numbers, and is current as of January 2022. For last month’s report, check out our previous infographic!
Or follow this link for all our FVREB Infographics!
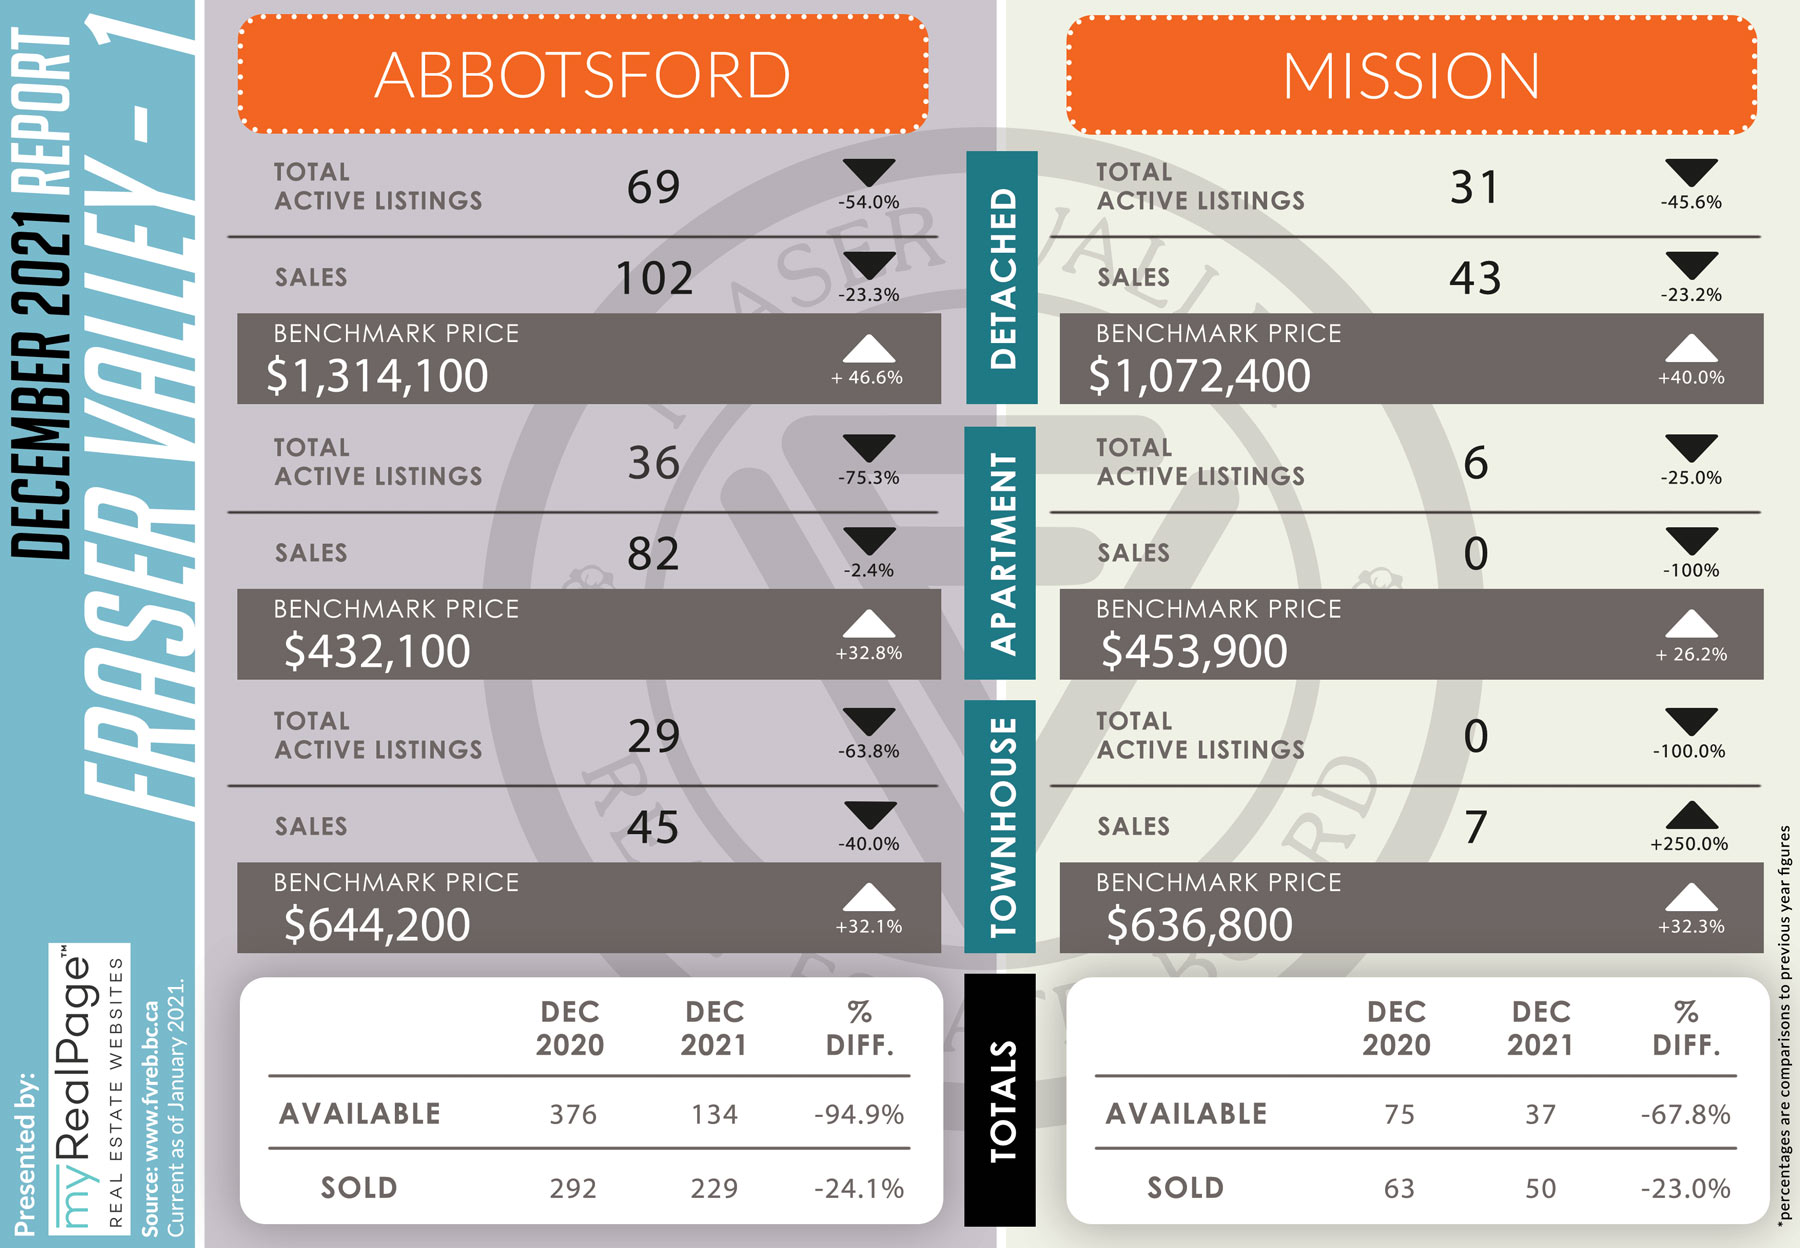
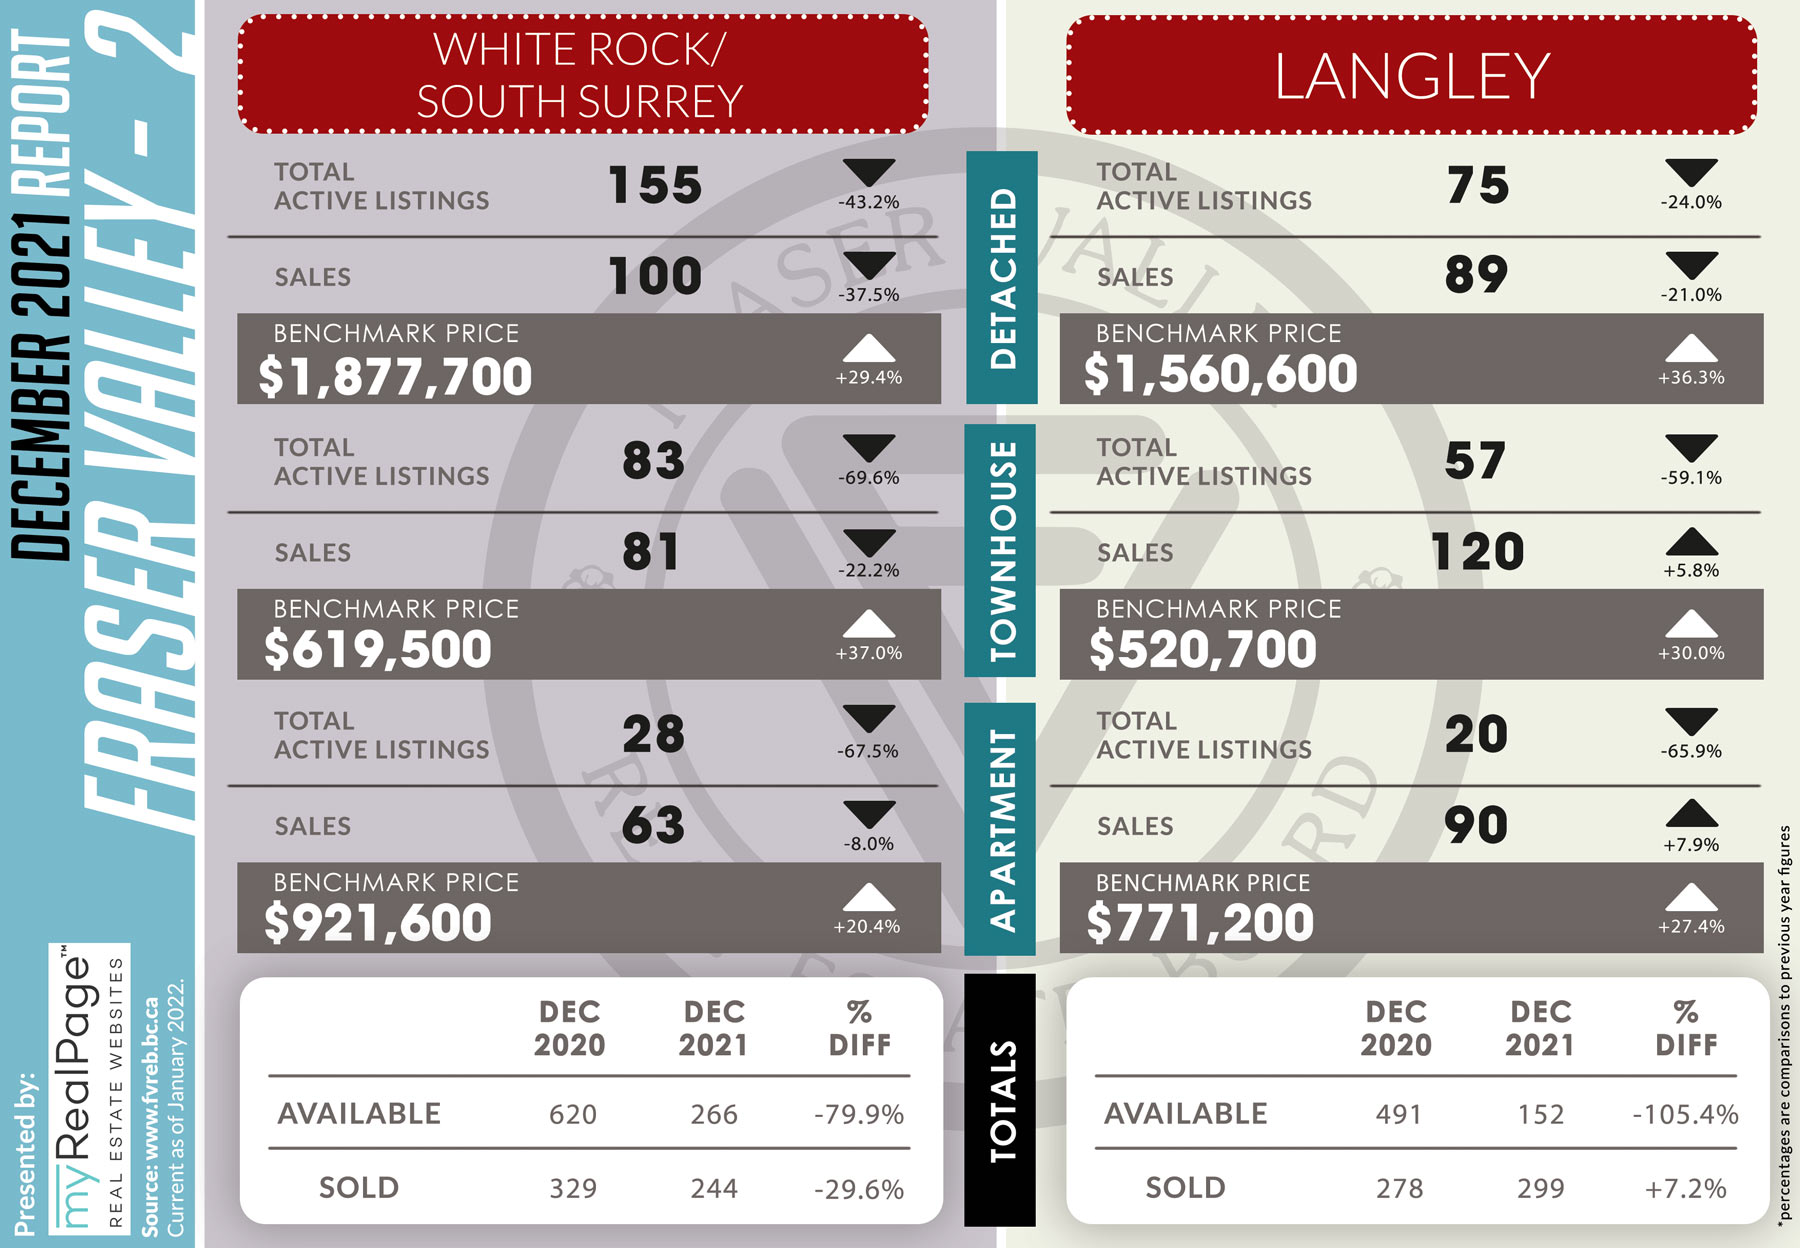
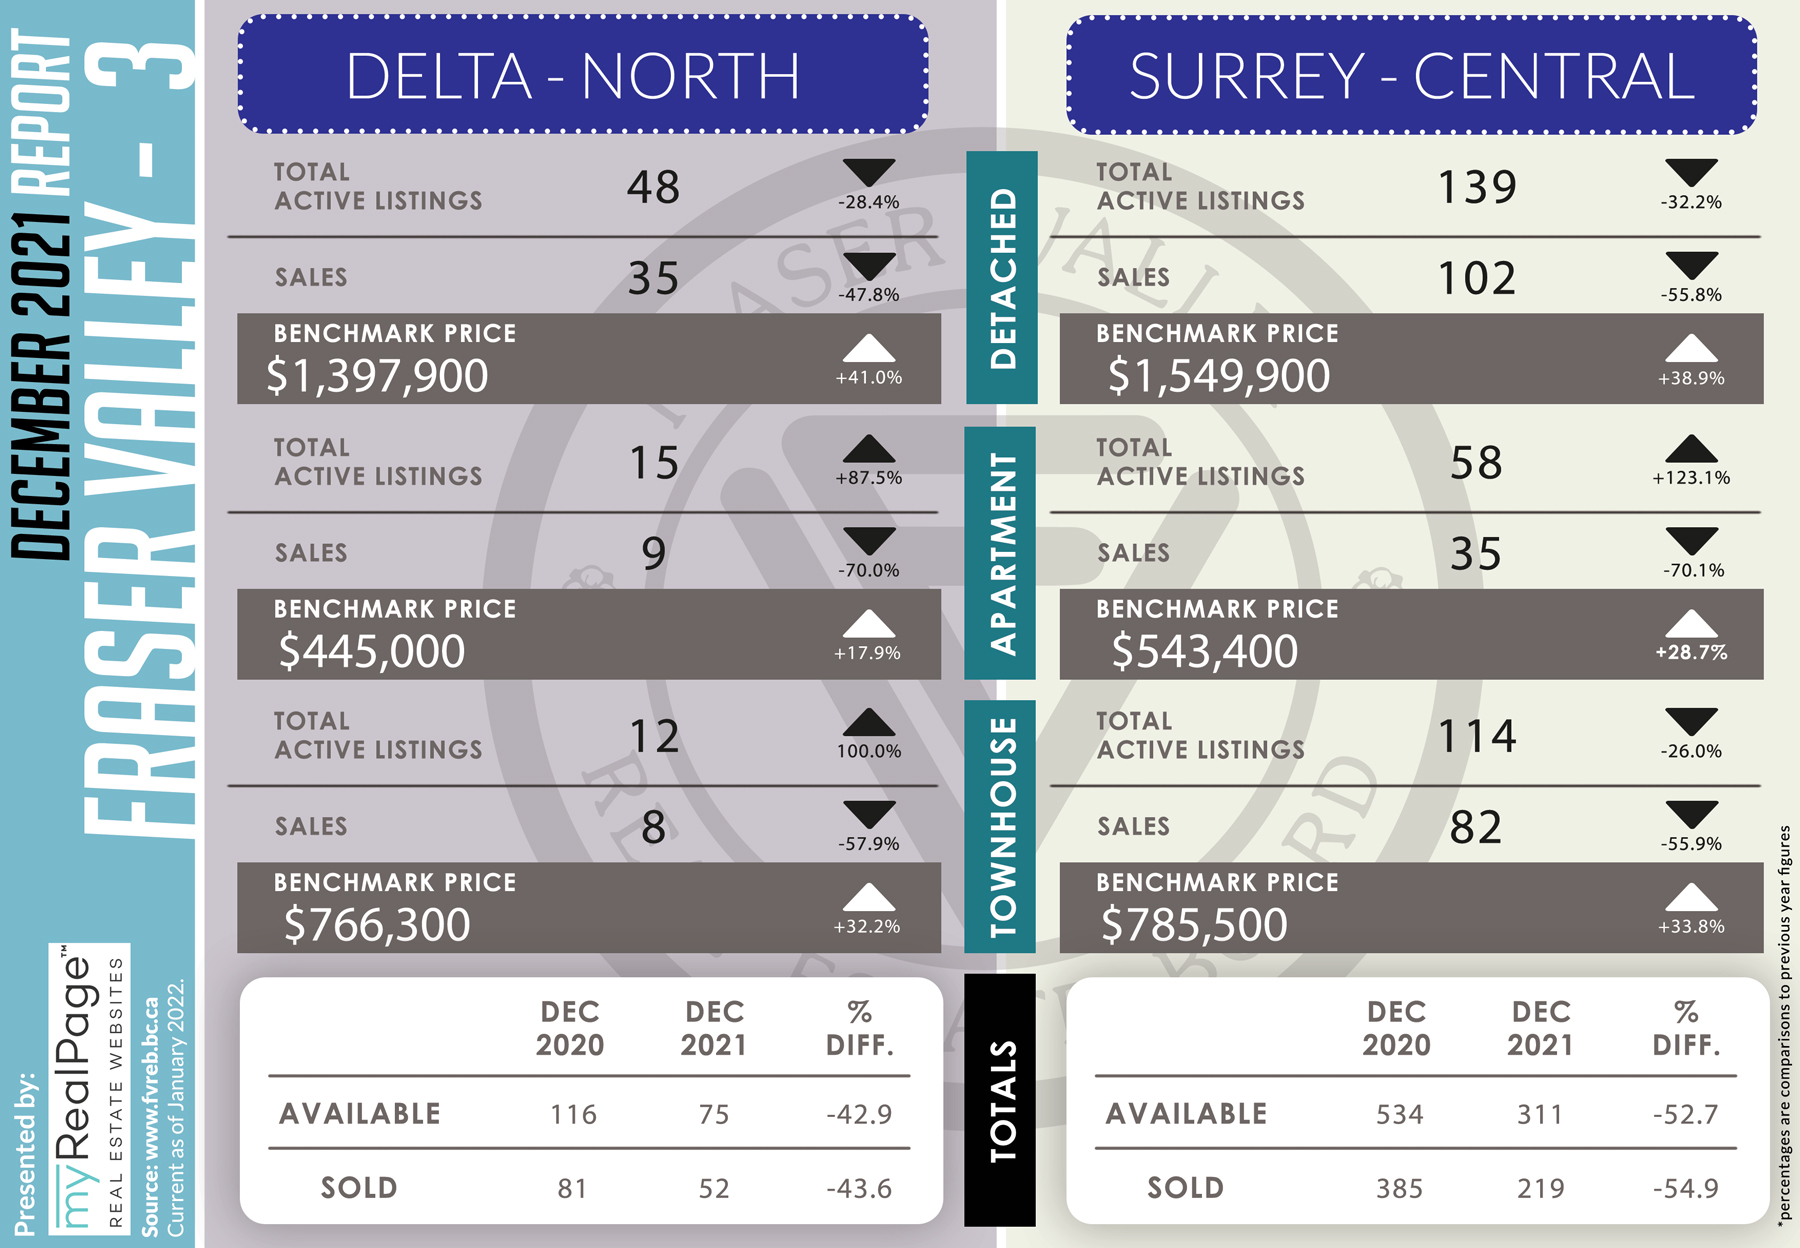
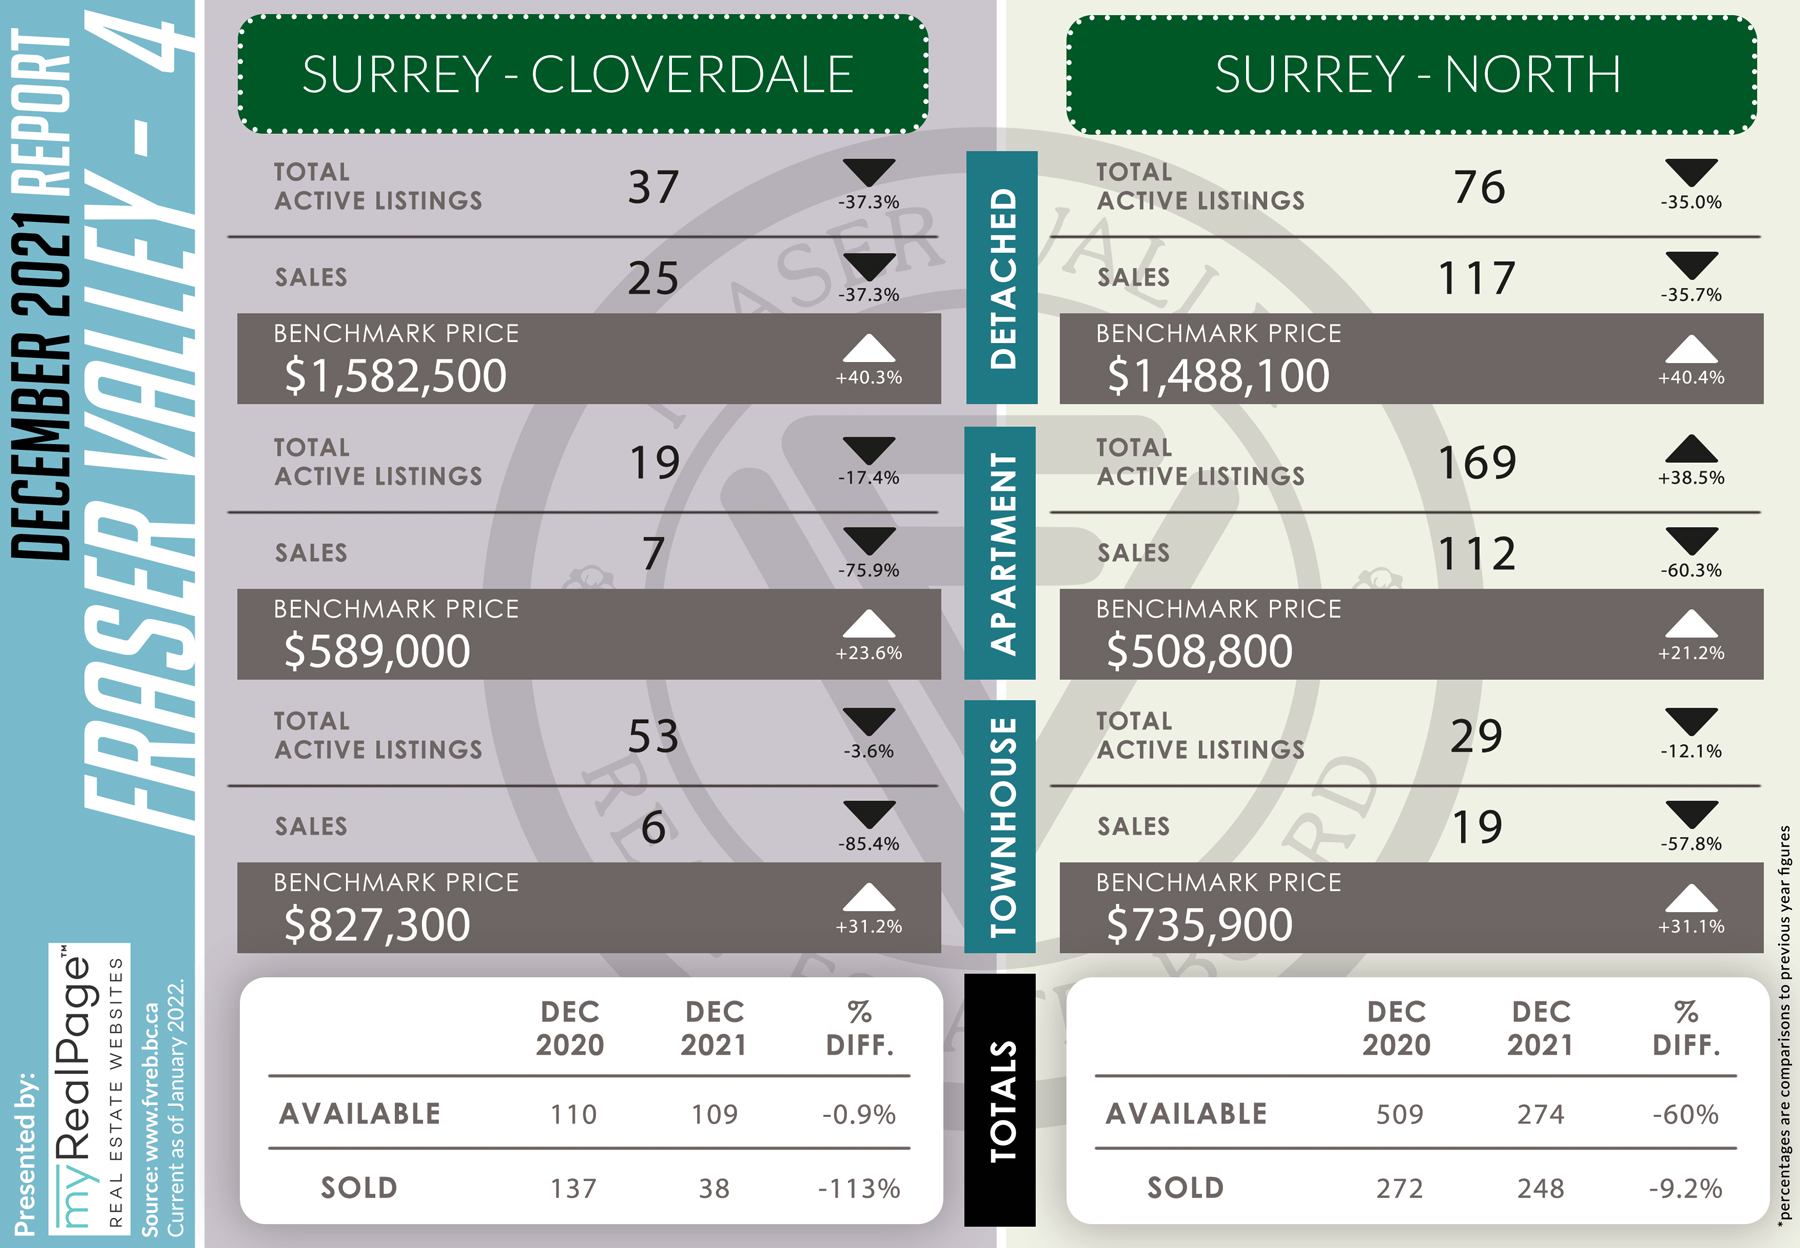
These infographics cover current trends in Fraser Valley neighbourhoods that are within the FVREB. Click on the images for a larger view!
Download Printable Version – FVREB December 2021 Market Report 1
Download Printable Version – FVREB December 2021 Market Report 2
Download Printable Version – FVREB December 2021 Market Report 3
Download Printable Version – FVREB December 2021 Market Report 4
Last Updated on July 25, 2022 by myRealPage
