INFOGRAPHICS: January 2022 TRREB Toronto Market Reports

Demand for ownership housing remained very strong from a historic perspective in January 2022
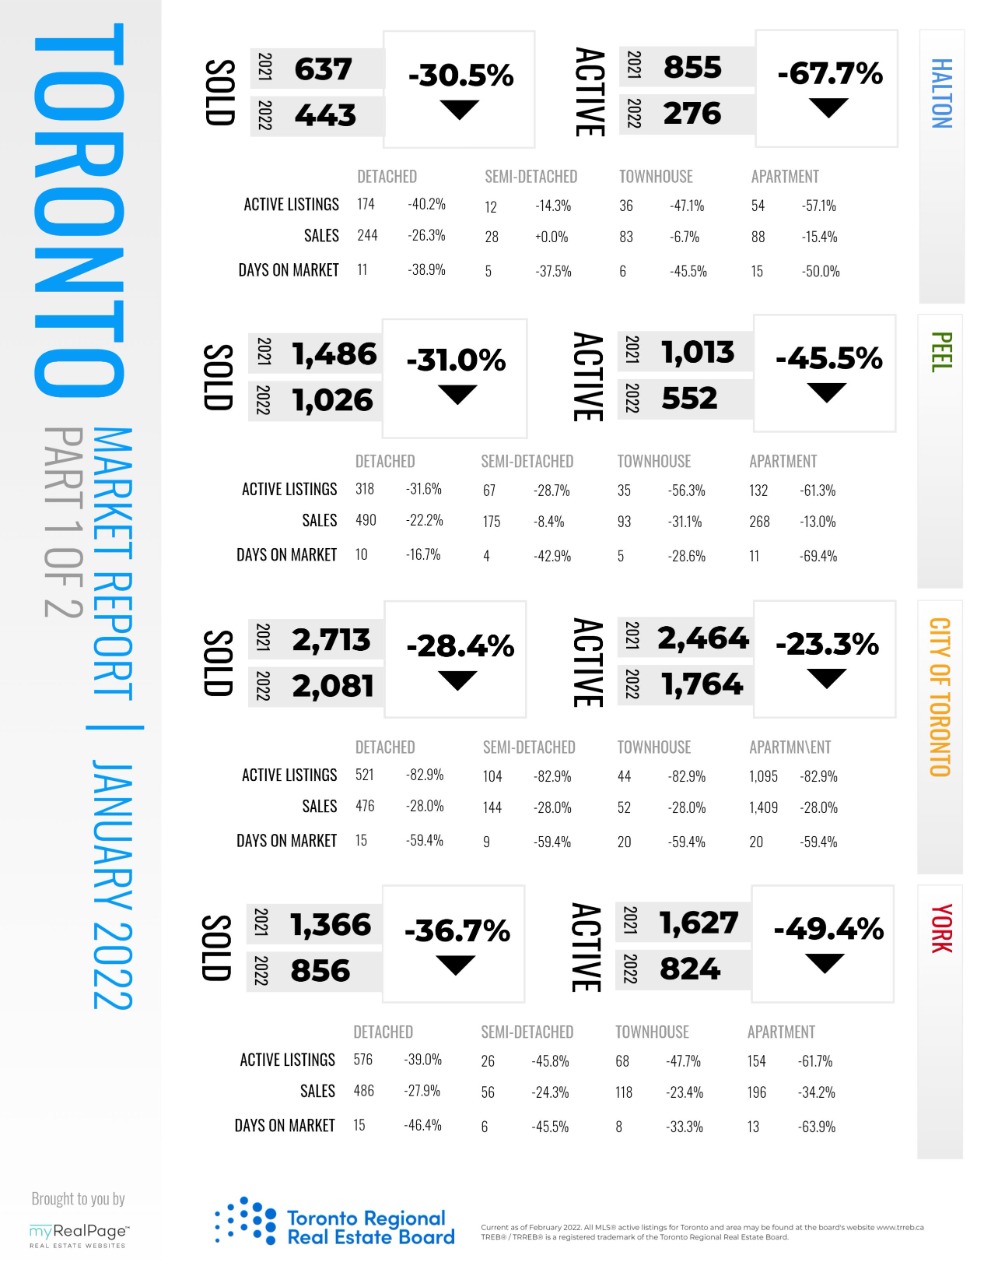
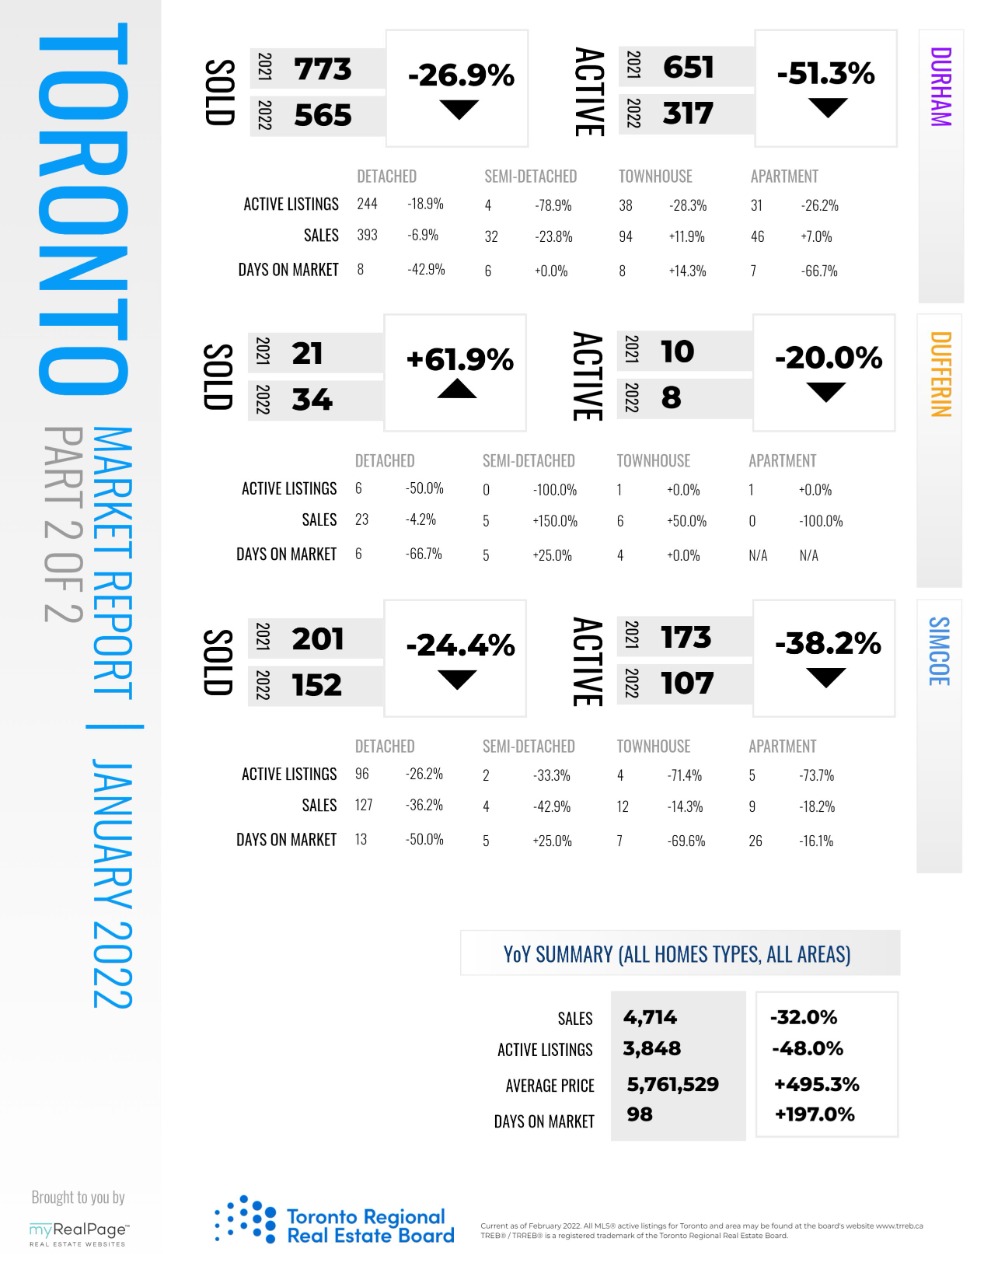
Demand for ownership housing remained very strong from a historic perspective in January 2022. At the same time, listings remained in short supply, resulting in tight market conditions and very strong year-over-year price growth.
There were 5,636 sales reported through the TRREB MLS® System in January 2022 – down by 18.2 per cent compared to 6,888 sales in January 2021. While sales were down substantially compared last year’s record result, the January 2022 result was the second best in history for the month. This result is in line with TRREB’s forecast for a strong sales result in 2022, but off the 2021 record.
New listings were down by a similar annual rate (-15.5 per cent) as sales. Because sales and new listings moved in relative lock step, active listings at the end of January amounted to 4,140 – down by 44 per cent to the lowest level in more than two decades.
Read the full report on TRREB website!
The following data is a comparison between January 2022 and January 2021 numbers, and is current as of February 2022. For last month’s numbers, check out our previous infographic!
Or follow this link for all our TREB / TRREB Infographics!
Download Printable Version – December 2021 TRREB, Toronto Market Report Part 1
Download Printable Version – December 2021 TRREB, Toronto Market Report Part 2
Last Updated on July 25, 2022 by myRealPage
