INFOGRAPHICS: July 2018 TREB Toronto Market Reports

Here’s this month’s market updates for areas covered by the Toronto Real Estate Board (TREB)!
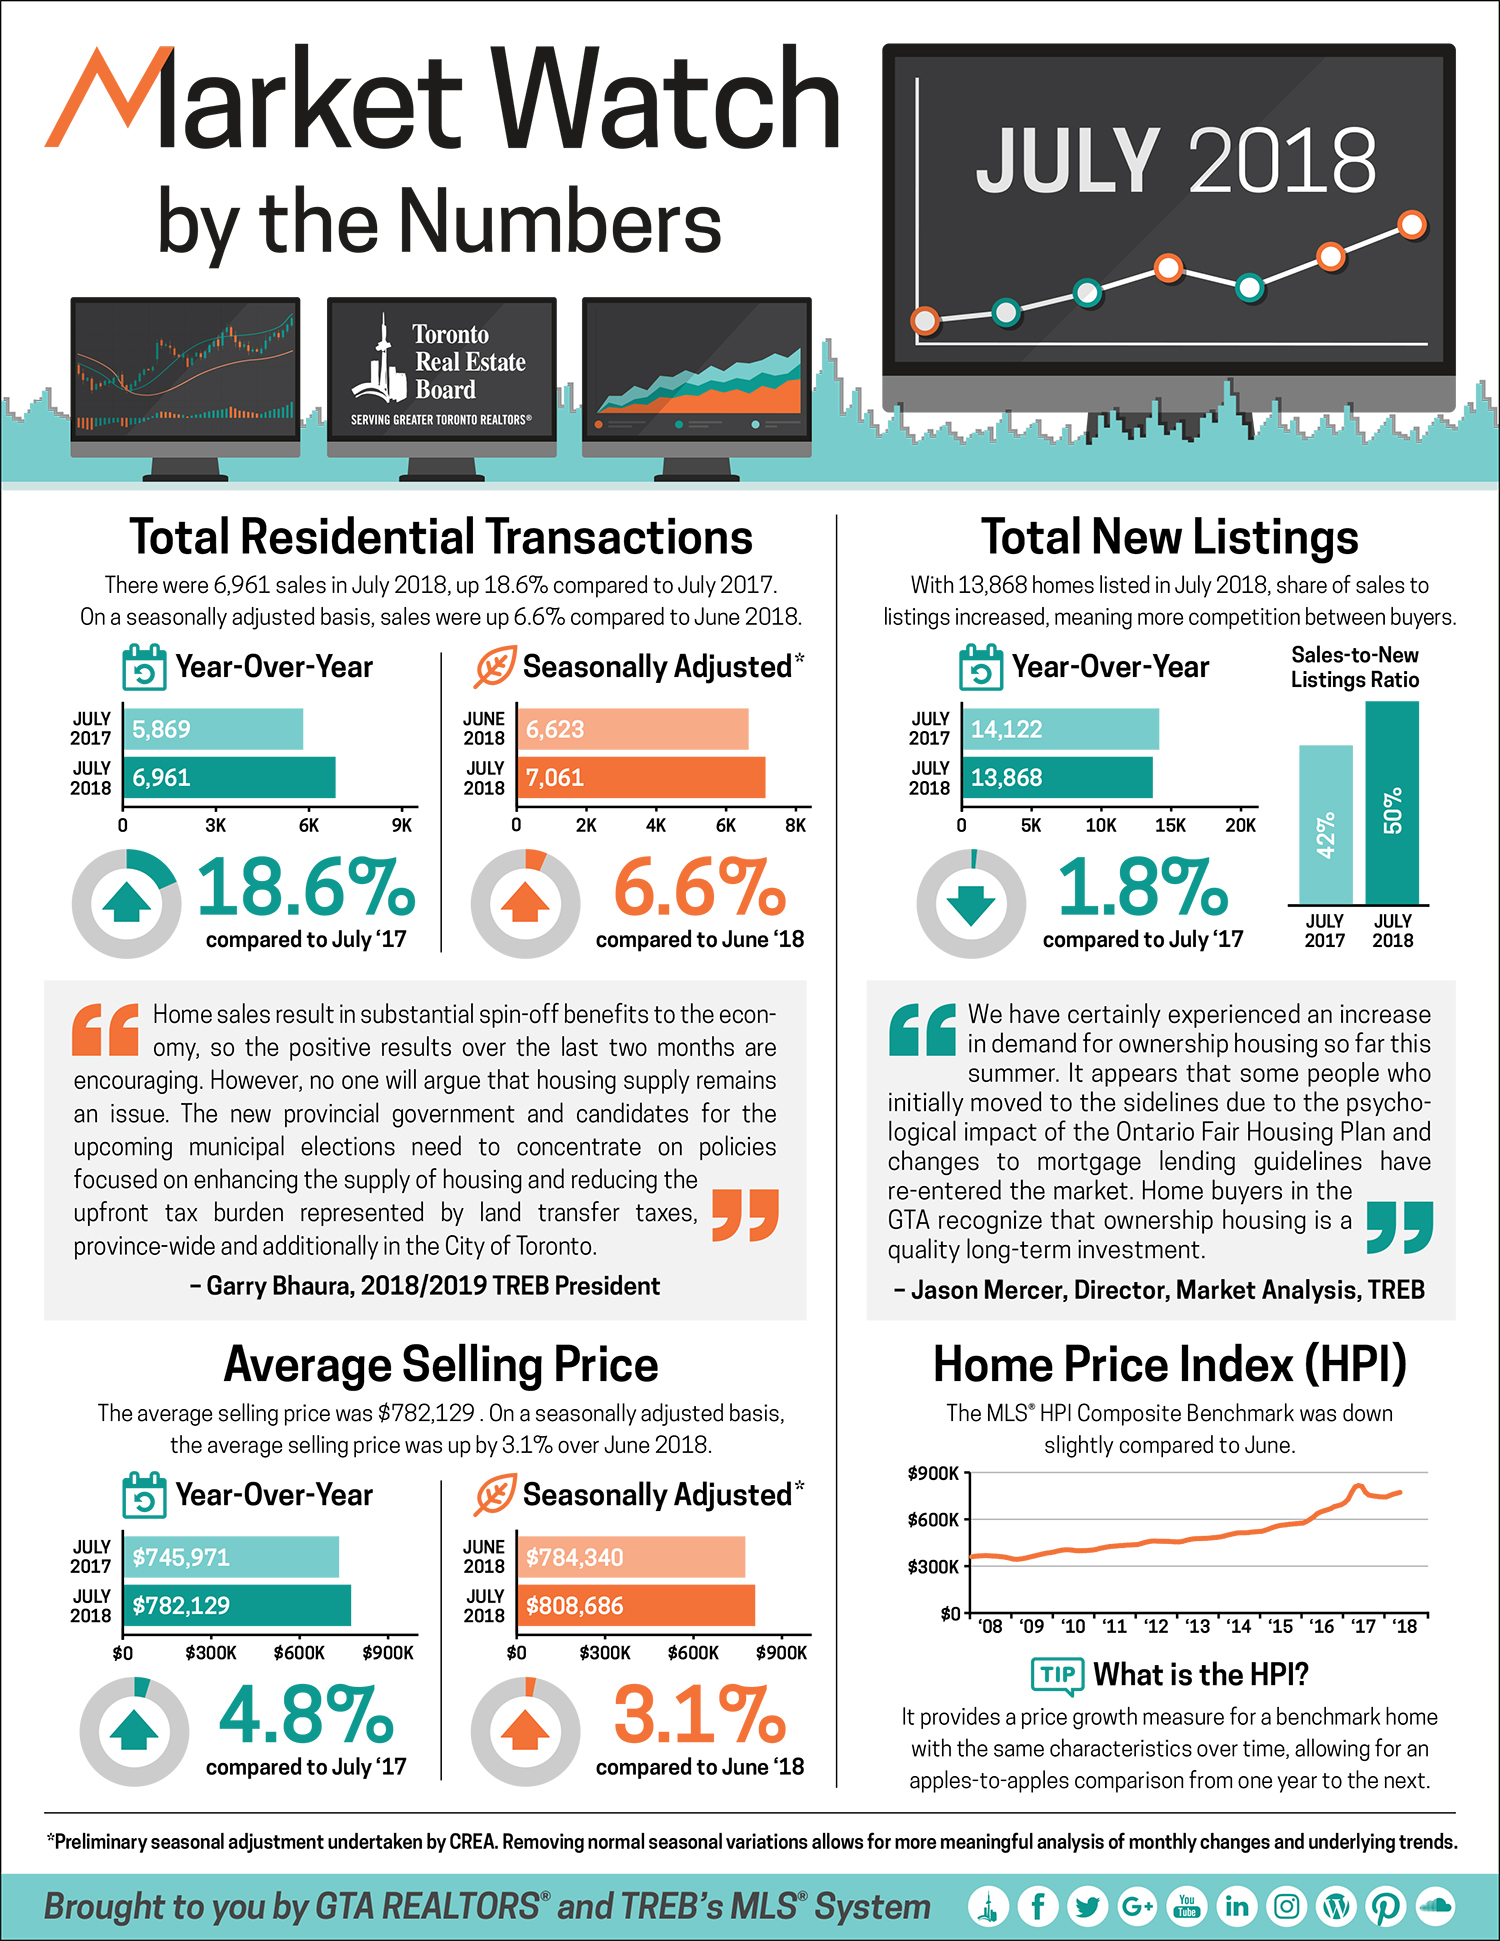
According to TREB’s latest media release, TREB President Garry Bhaura has announced strong growth in the number of home sales and the average selling price reported by Greater Toronto Area REALTORS® in July 2018.
“Home sales result in substantial spin-off benefits to the economy, so the positive results over the last two months are encouraging. However, no one will argue that housing supply remains an issue. The new provincial government and candidates for the upcoming municipal elections need to concentrate on policies focused on enhancing the supply of housing and reducing the upfront tax burden represented by land transfer taxes, province-wide and additionally in the City of Toronto,” said Mr. Bhaura.
Jason Mercer, TREB’s Director of Market Analysis, has also shared optimistic views for the season.
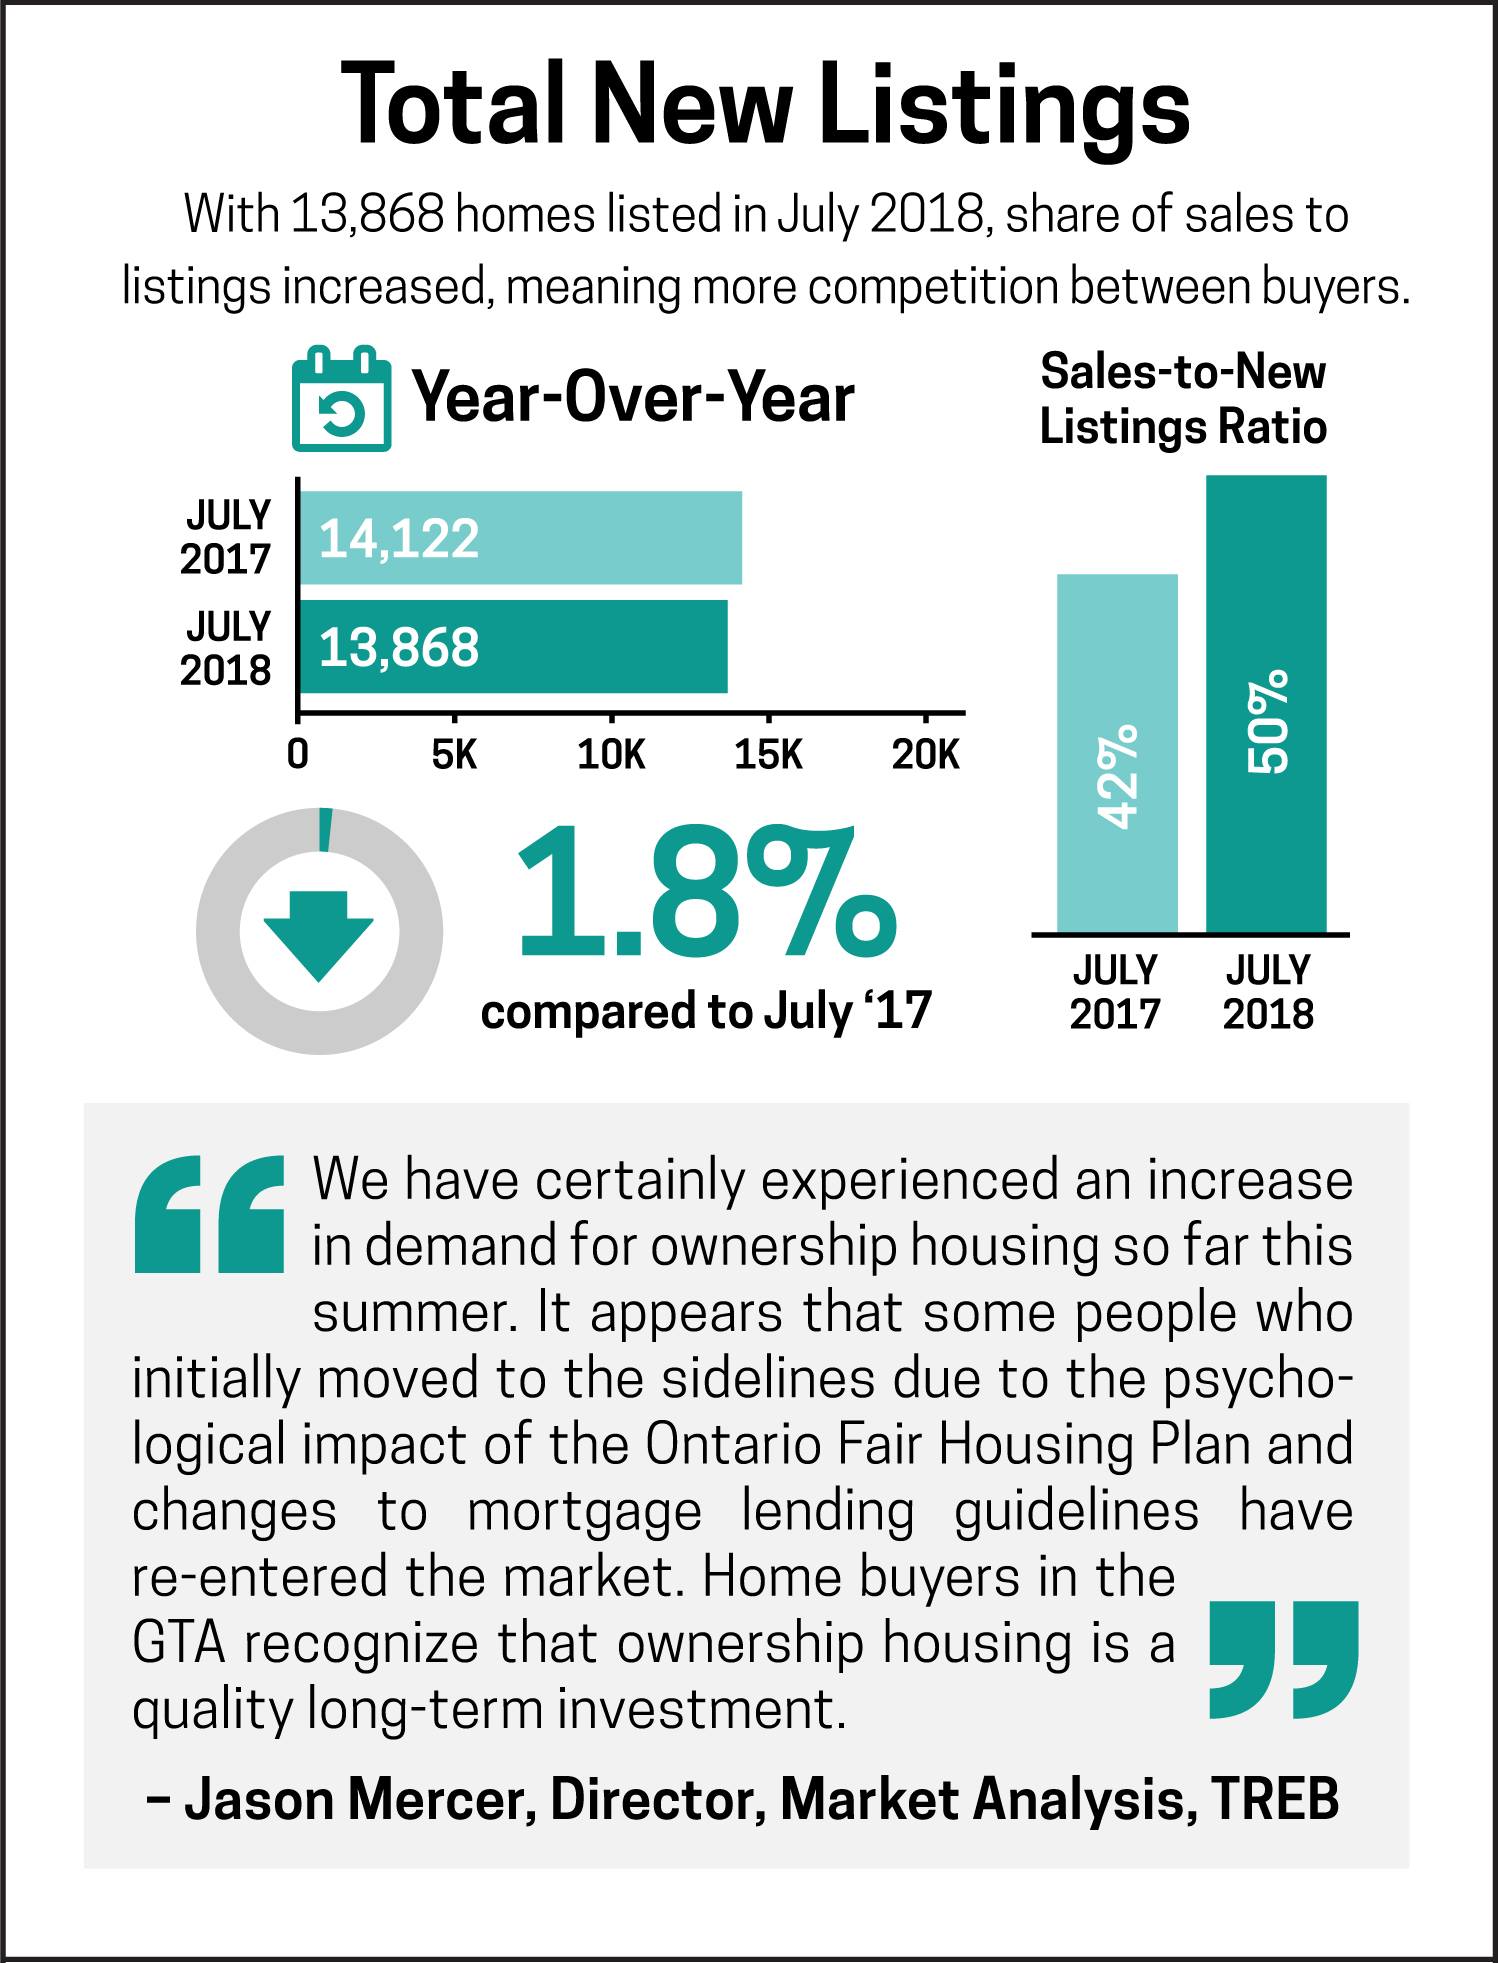
Image source: https://www.facebook.com/TorontoRealEstateBoard/
UPDATE: In January 2020, TREB has since rebranded to TRREB, the Toronto Regional Real Estate Board.
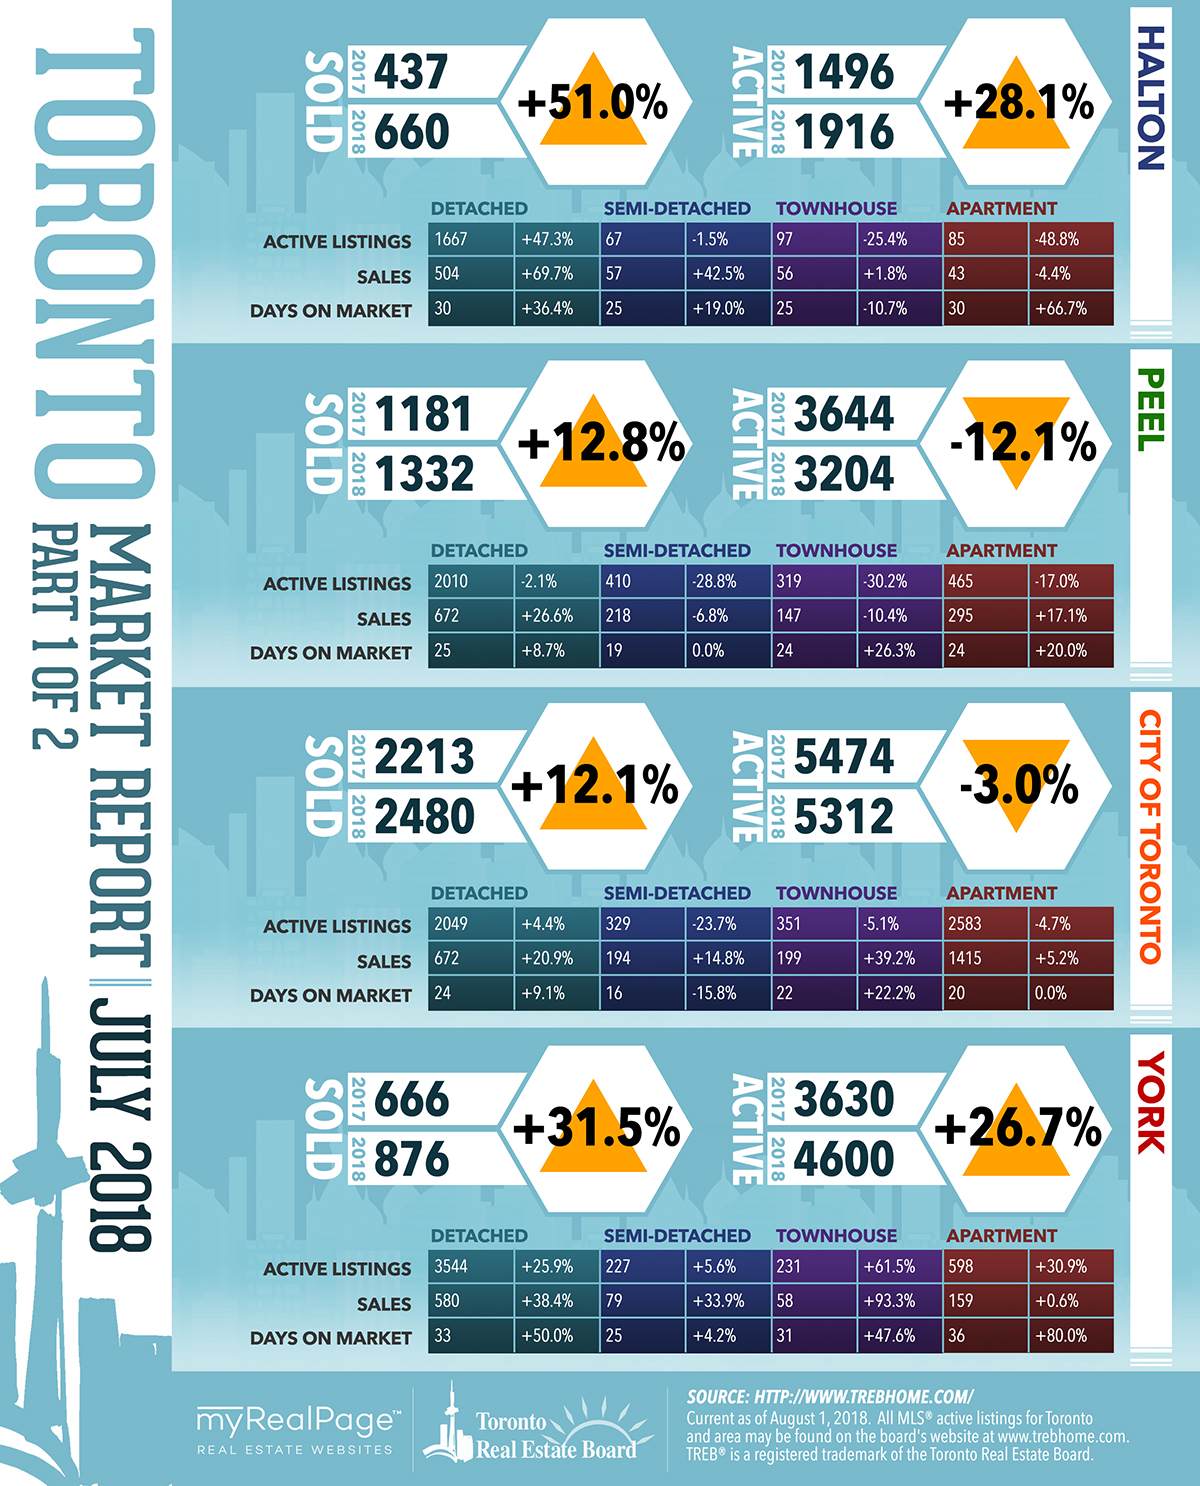
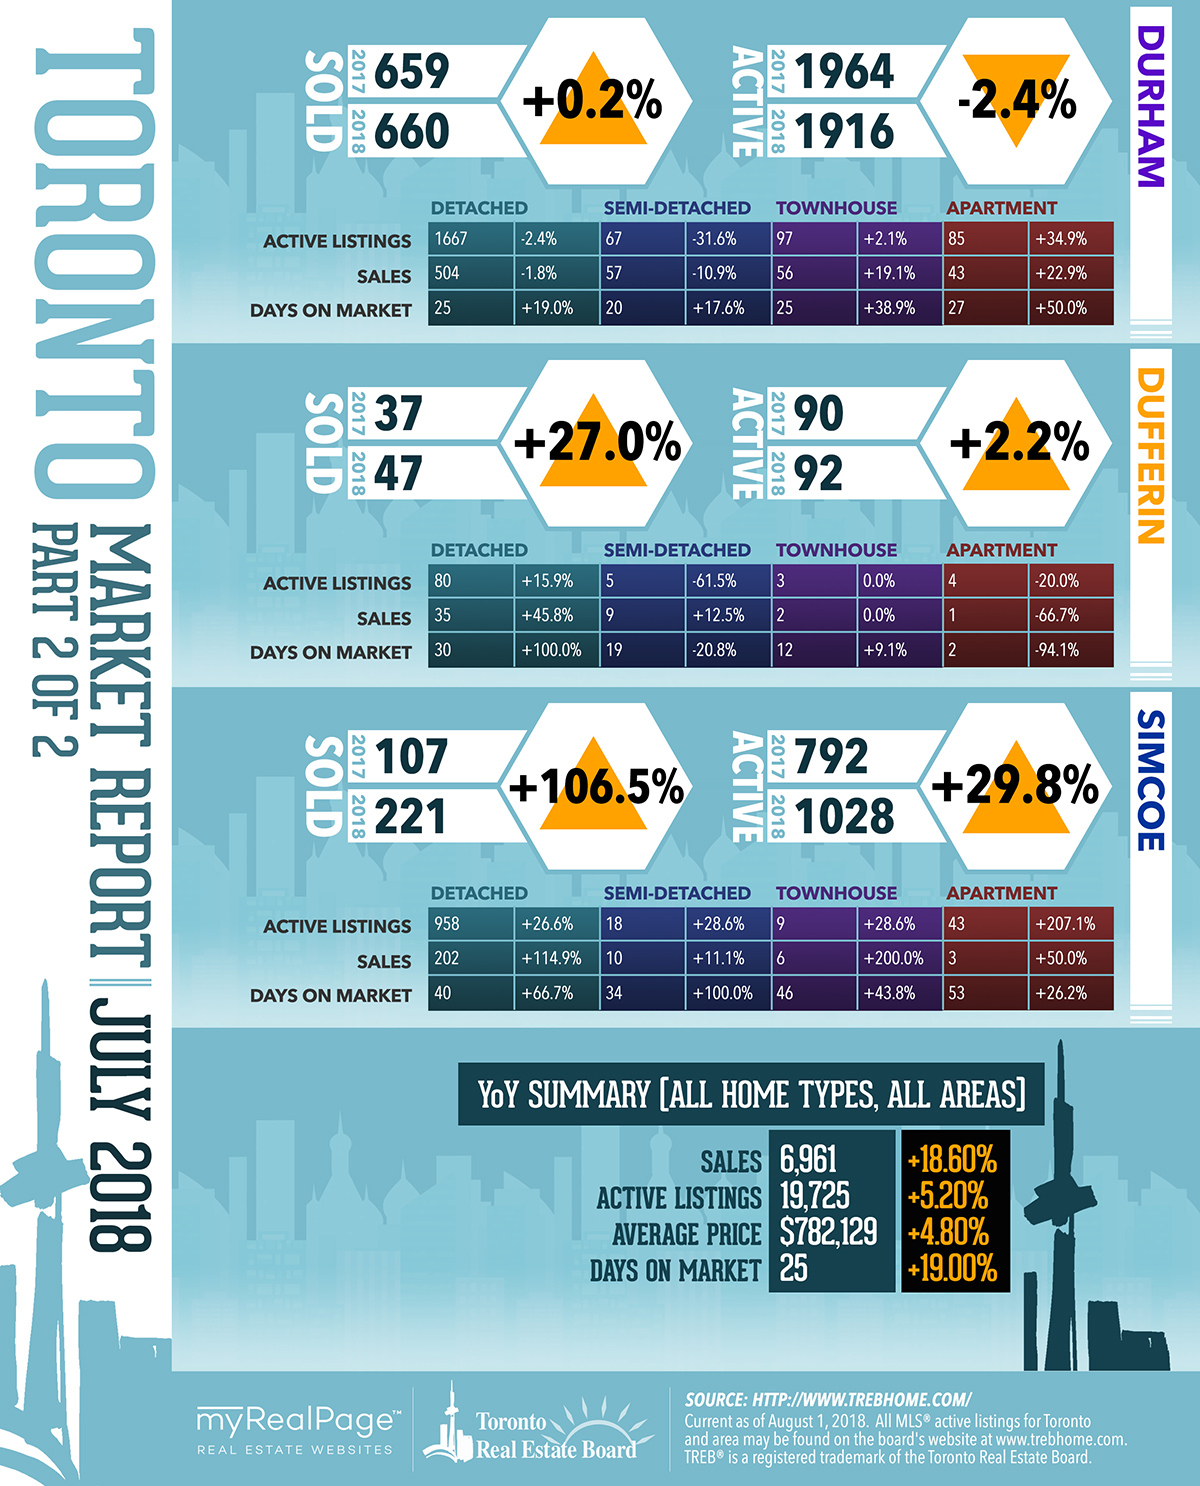
The following data is a comparison between July 2017 and July 2018 numbers, and is current as of August 2018. For last month’s numbers, check out our previous infographic! Or follow this link for all our TREB Infographics!
Click on the images for a larger view!
(Protip: Make sure to grab the printable PDF versions, too! It fits best when printed on A4-sized sheets, AND we’ve added an area on the sheet where you can attach your business card! 🙂 )
Download Printable Version – July 2018 TREB, Toronto Market Report
Last Updated on July 25, 2022 by myRealPage
