INFOGRAPHICS: July 2020 FVREB Fraser Valley, South Surrey, Etc. Market Reports
Sales and new listings reach near record-setting numbers in the Fraser Valley
The Fraser Valley Real Estate Board’s Multiple Listing Service® (MLS®) saw the second-highest number of both property sales and new listings ever recorded in July.
The FVREB processed a total of 2,100 sales in July, an increase of 22.2% compared to sales in June and an increase of 44% compared to the 1,458 sales during July of last year. Last month’s sales were 25.5% above the ten-year average for July and second only to July 2015.
The Fraser Valley Board received 3,549 new listings in July , a 2.7% increase compared to June’s intake of 3,456 new listings and a 26.9% increase compared to July of last year. July’s new listings were 18.3% above the ten-year average for the month and second only to July 2008. Last month finished with 7,341 active listings, an increase of 3.9% compared to June’s inventory and a decrease of 12% year-over-year.
Read the full report on the FVREB website!
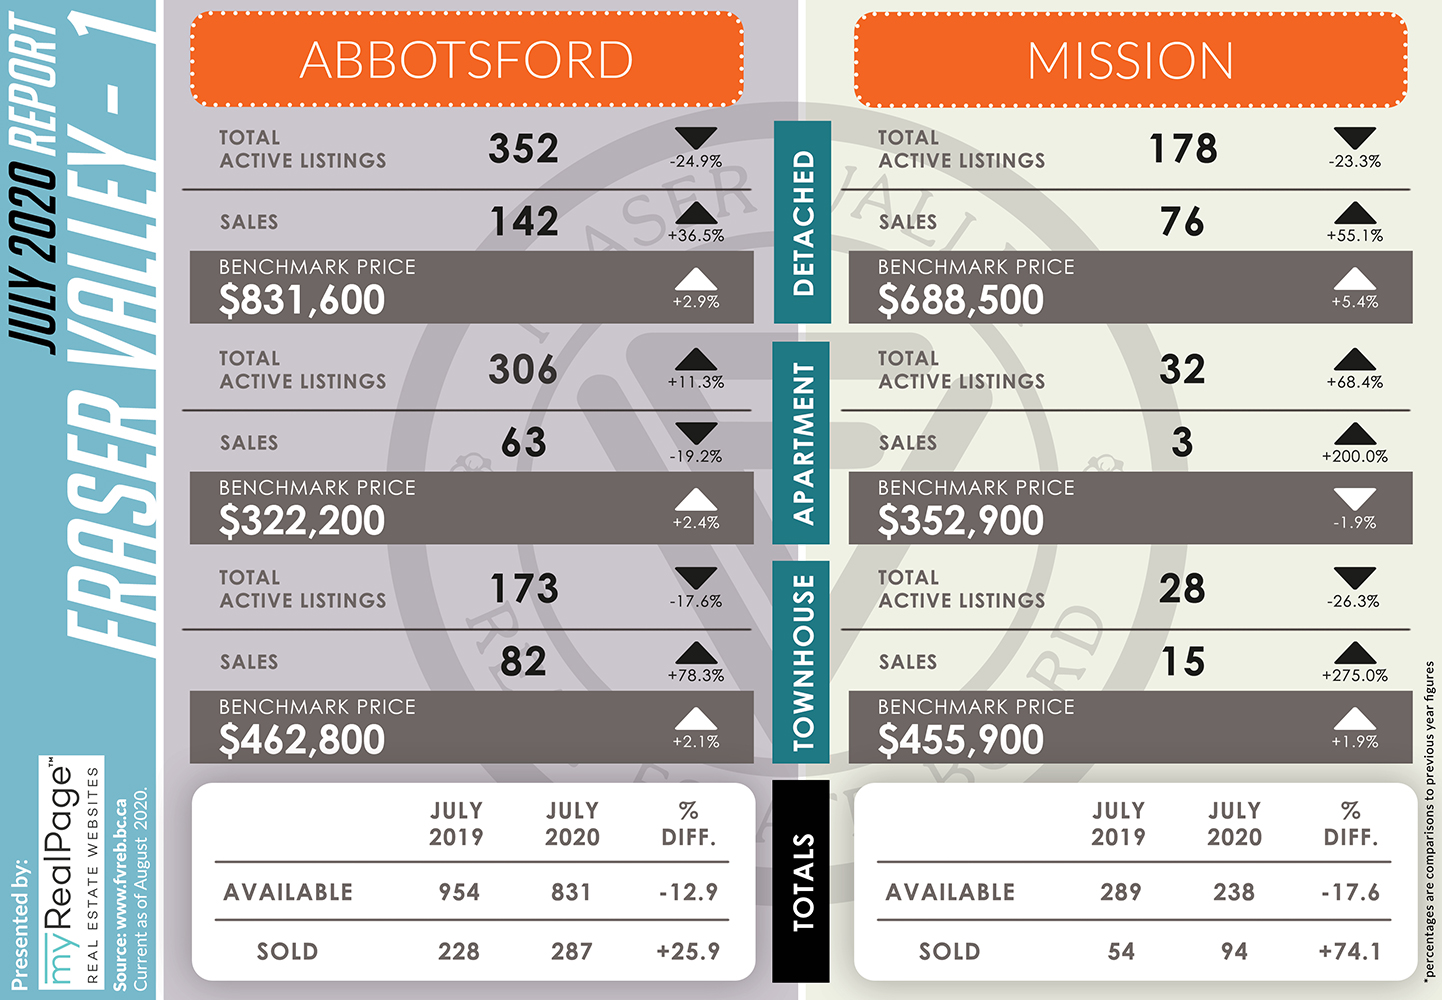
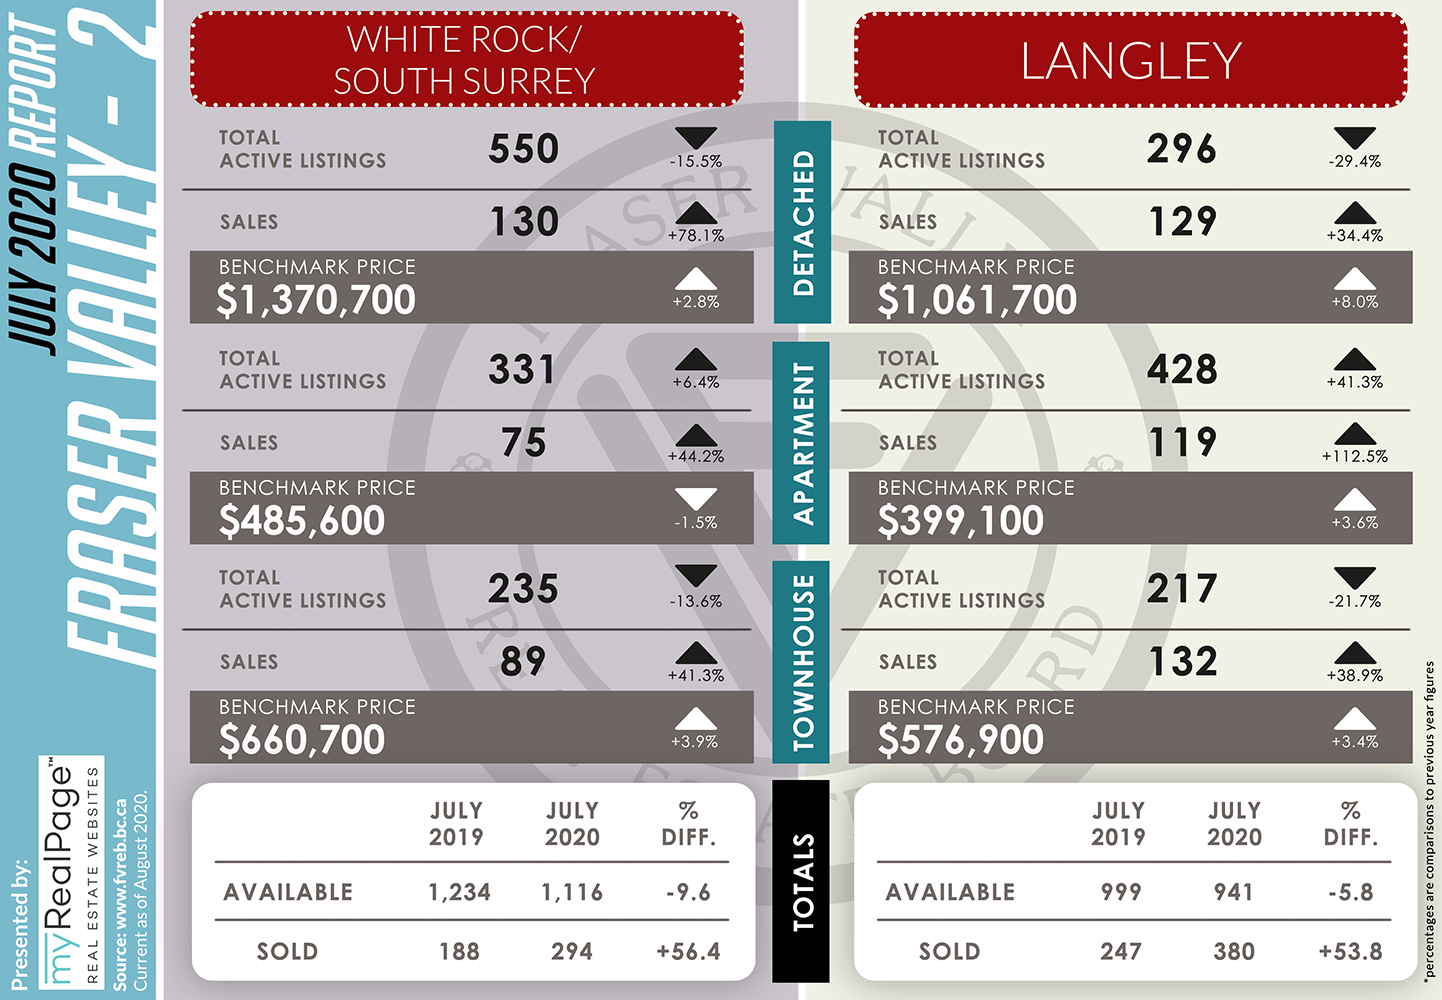
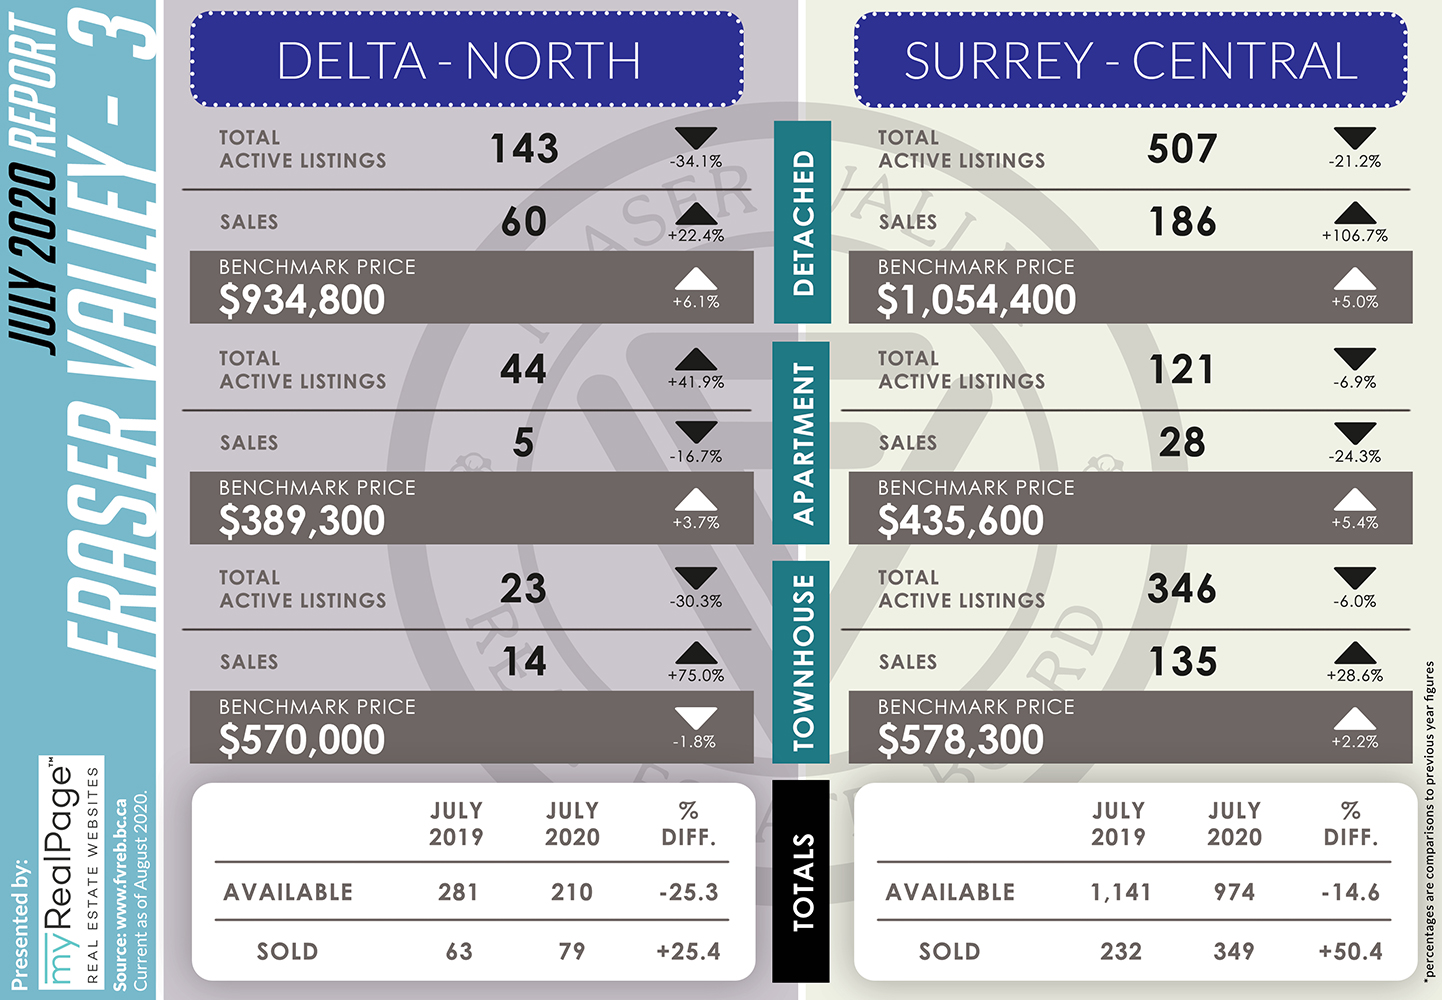
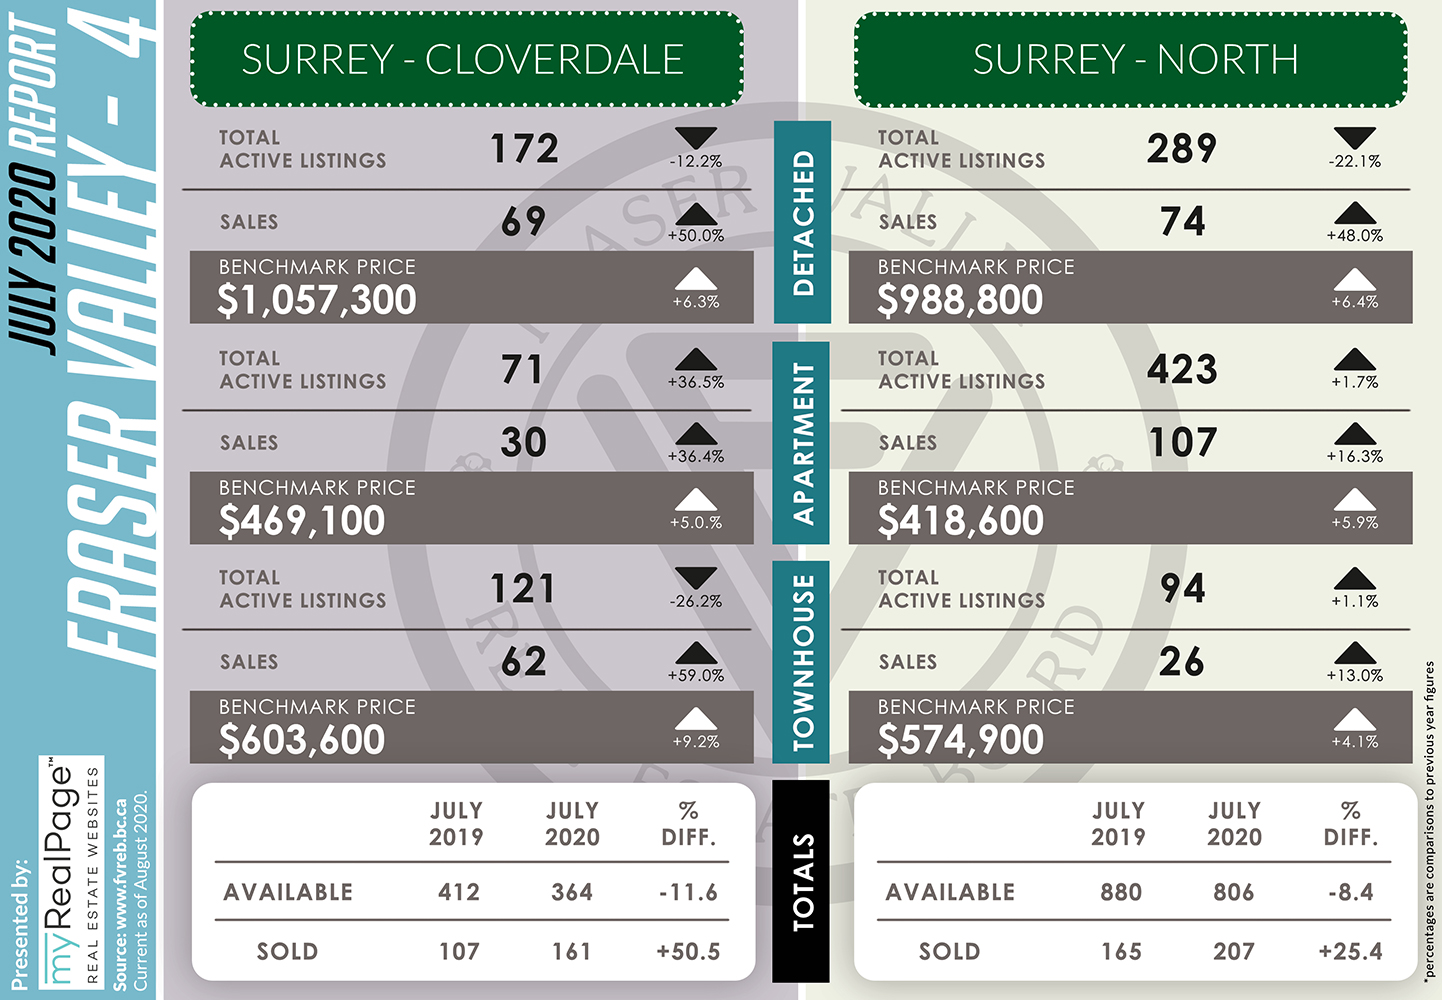
The following data is a comparison between July 2019 and July 2020 numbers, and is current as of August 2020. For last month’s report, check out our previous infographic!
Or follow this link for all our FVREB Infographics!
These infographics cover current trends in Fraser Valley neighbourhoods that are within the FVREB. Click on the images for a larger view! (Protip: Make sure to grab the printable PDF version, too! It fits best when printed on A4-sized sheets, AND we’ve added an area on the sheet where you can attach your business card! 🙂 )
Download Printable Version – FVREB July 2020 Market Report
Last Updated on July 25, 2022 by myRealPage
