INFOGRAPHICS: July 2020 TRREB Toronto Market Reports

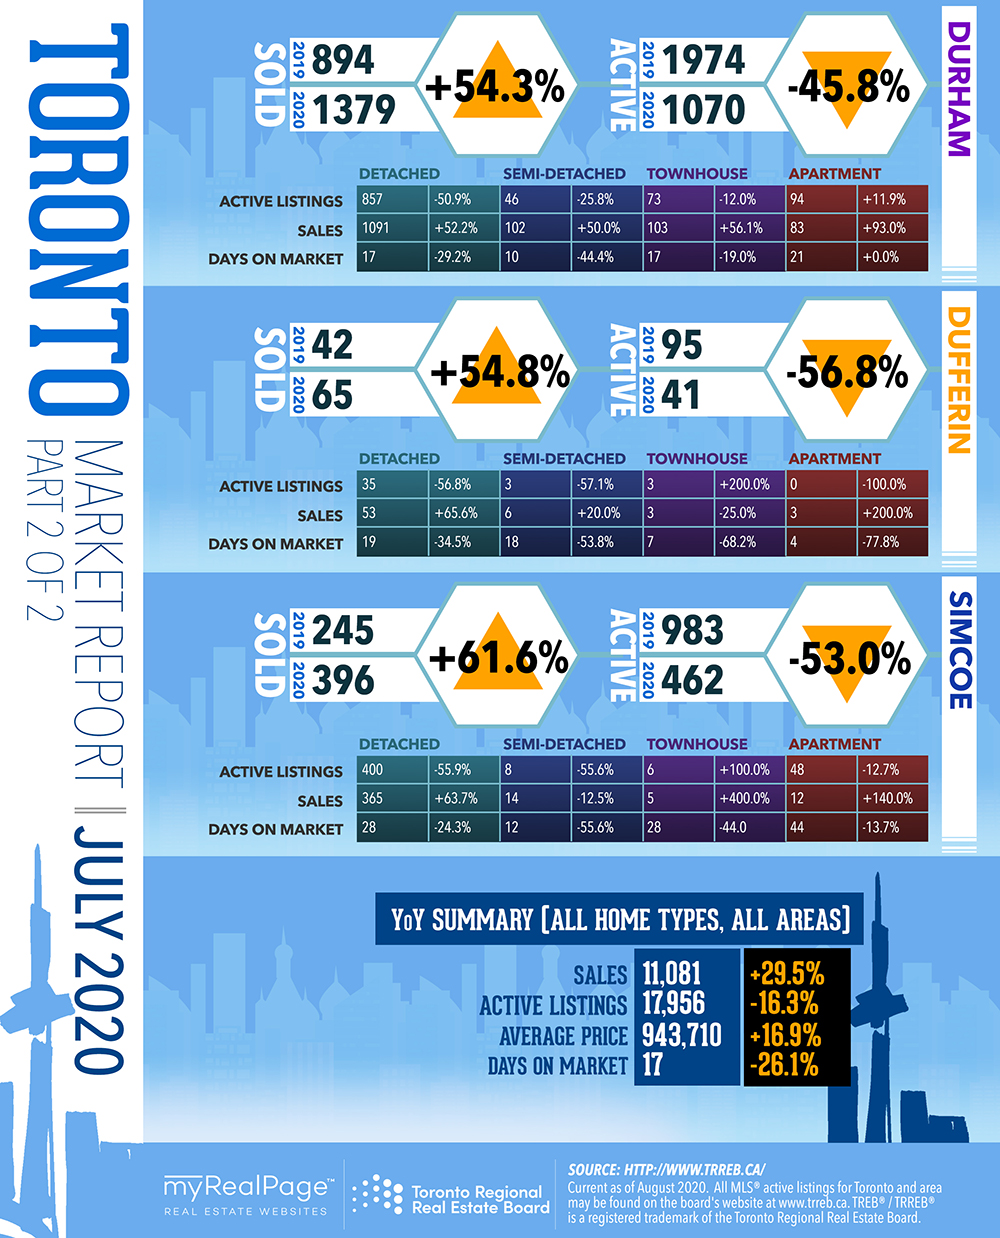
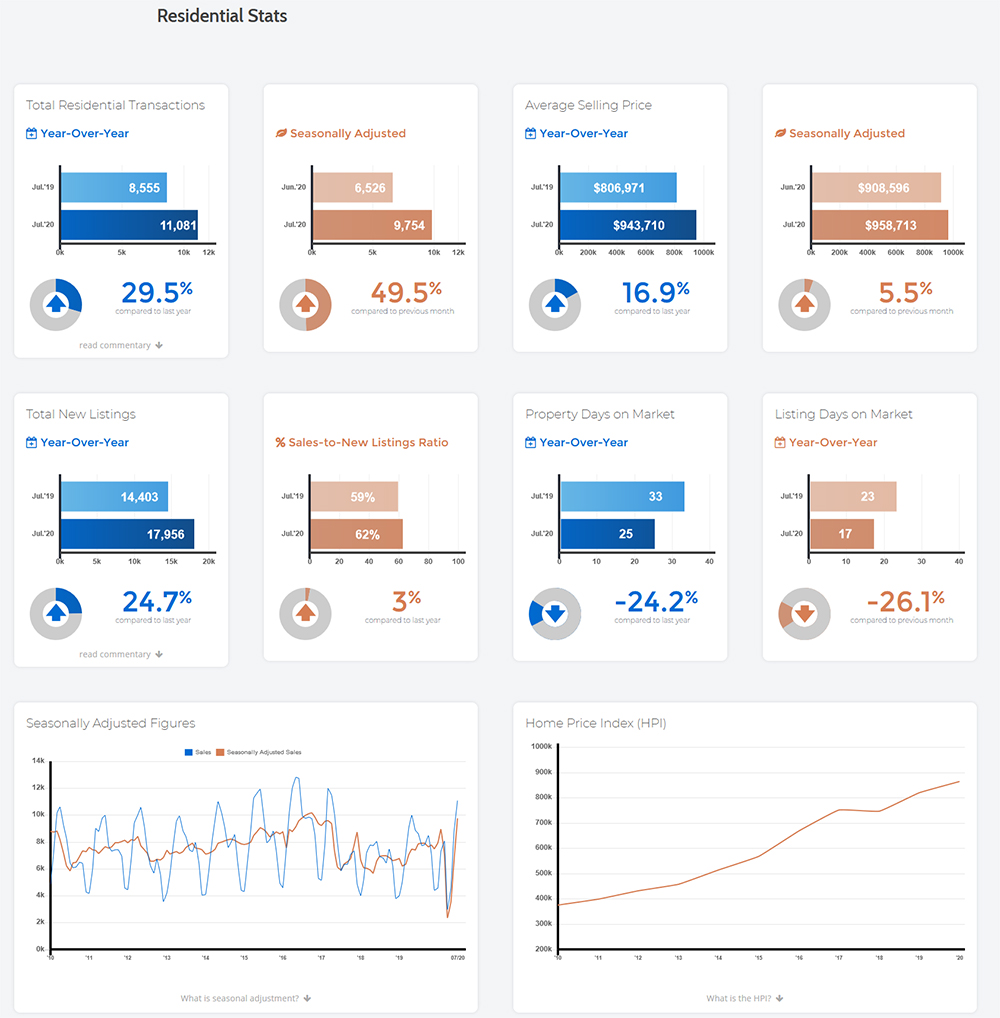
Toronto Regional Real Estate Board President Lisa Patel announces that Greater Toronto Area REALTORS® reported 11,081 sales through TRREB’s MLS® System in July 2020 – a 29.5% increase over July 2019 and a new record for the month of July. On a preliminary seasonally adjusted basis, sales were up by 49.5% compared to June 2020.
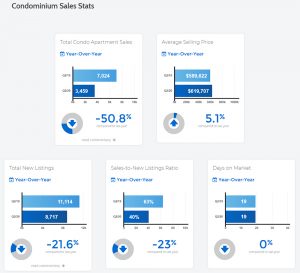
Year-over-year sales growth was driven by low-rise home types, particularly in the regions surrounding the City of Toronto. However, condominium apartment sales were also up on an annual basis, including in Toronto.
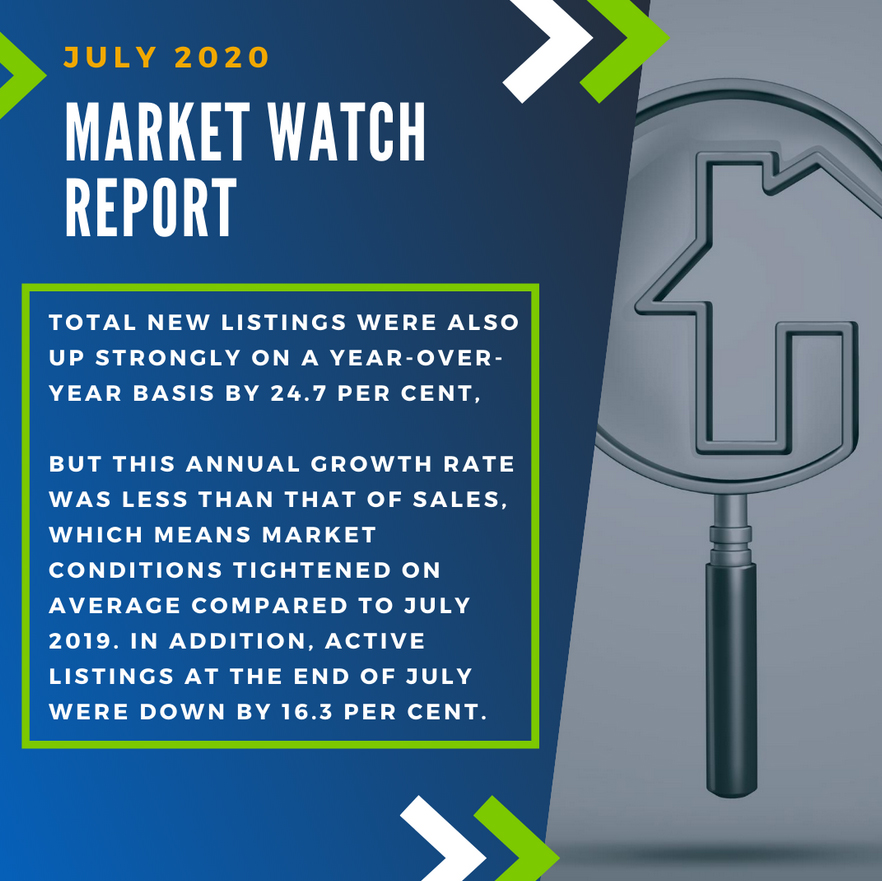
Total new listings were also up strongly on a year-over-year basis by 24.7%, but this annual growth rate was less than that of sales, which means market conditions tightened on average compared to July 2019. In addition, active listings at the end of July were down by 16.3%.
Read the full report on the TRREB website!
The following data is a comparison between July 2019 and July 2020 numbers, and is current as of August 2020. For last month’s numbers, check out our previous infographic!
Or follow this link for all our TREB / TRREB Infographics!
Click on the images for a larger view! (Protip: Make sure to grab the printable PDF versions, too! It fits best when printed on A4-sized sheets, AND we’ve added an area on the sheet where you can attach your business card! 🙂 )
Download Printable Version – July 2020 TRREB, Toronto Market Report

-
- (Image Source: TRREB website)
-

- (Image Source: TRREB website)
-
- (Image Source: TRREB website)

-
- (Image Source: TRREB website)
-

- (Image Source: TRREB Twitter)
-

- (Image Source: TRREB Twitter)

-

- (Image Source: TRREB Twitter)

Last Updated on July 25, 2022 by myRealPage
