INFOGRAPHICS: July 2020 VIREB Vancouver Island Market Reports

VIREB’s housing market continues to recover from the COVID-19 downturn seen in April and part of May.
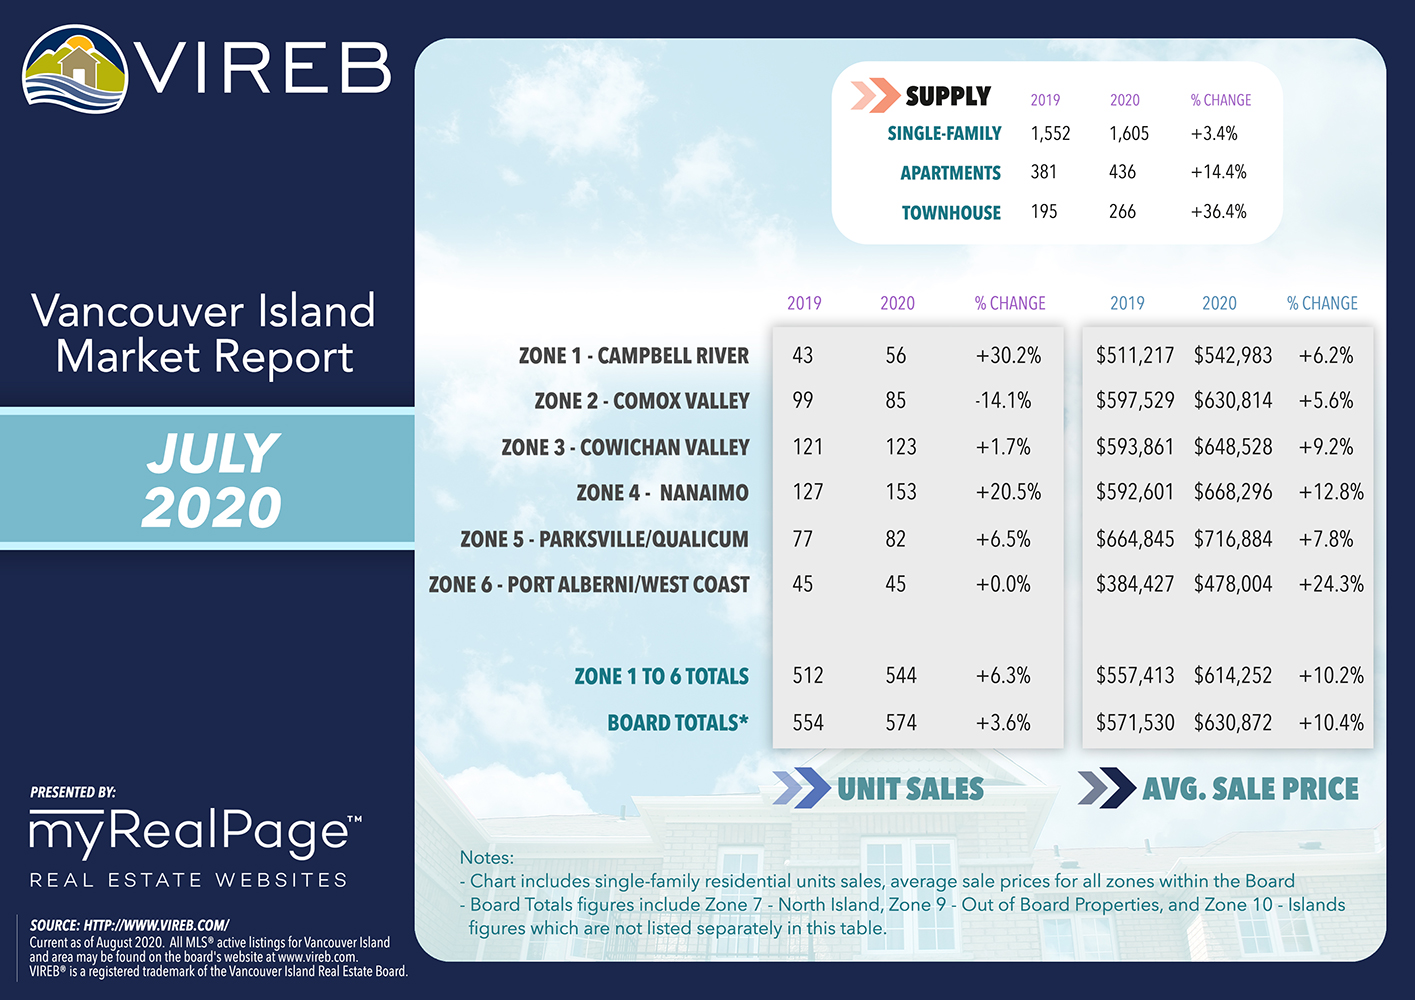
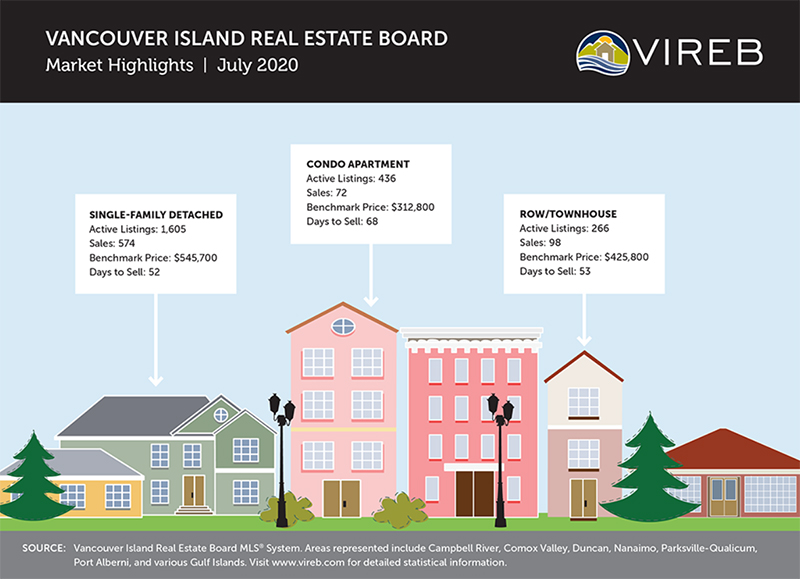
A total of 892 units sold in July 2020, down 4% from the 931 sales posted in July 2019. Breaking down those sales by category, 574 single-family detached properties sold on the MLS® System last month compared to 573 in June 2020 and 554 in July 2019. Sales of condo apartments dipped by 14% year over year while row/townhouse sales dropped by 16%.
The benchmark price of a single-family home board-wide was $545,700 in July, an increase of 6% from the previous year and 2% higher than in June. In the apartment category, the year-over-year benchmark price rose by 4%, hitting $312,800 and up marginally from June. The benchmark price of a townhouse in July rose by 4% year over year, climbing to $425,800 but down slightly from June.
Read the full report on the VIREB website!
The following data is a comparison between July 2019 and July 2020 numbers, and is current as of August 2020. Click here to check out last month’s infographics.
You can also view all our VIREB infographics by clicking here.
Click on the images for a larger view! (Protip: Make sure to grab the printable PDF versions, too! It fits best when printed on A4-sized sheets, AND we’ve added an area on the sheet where you can attach your business card! 🙂 )
Download Printable Version – July 2020 VIREB Market Report
(Image source: VIREB Twitter)
Last Updated on July 25, 2022 by myRealPage
