INFOGRAPHICS: June 2020 CREB City And Region Market Reports
Sales decline by 2% from last year amidst COVID-19 pandemic
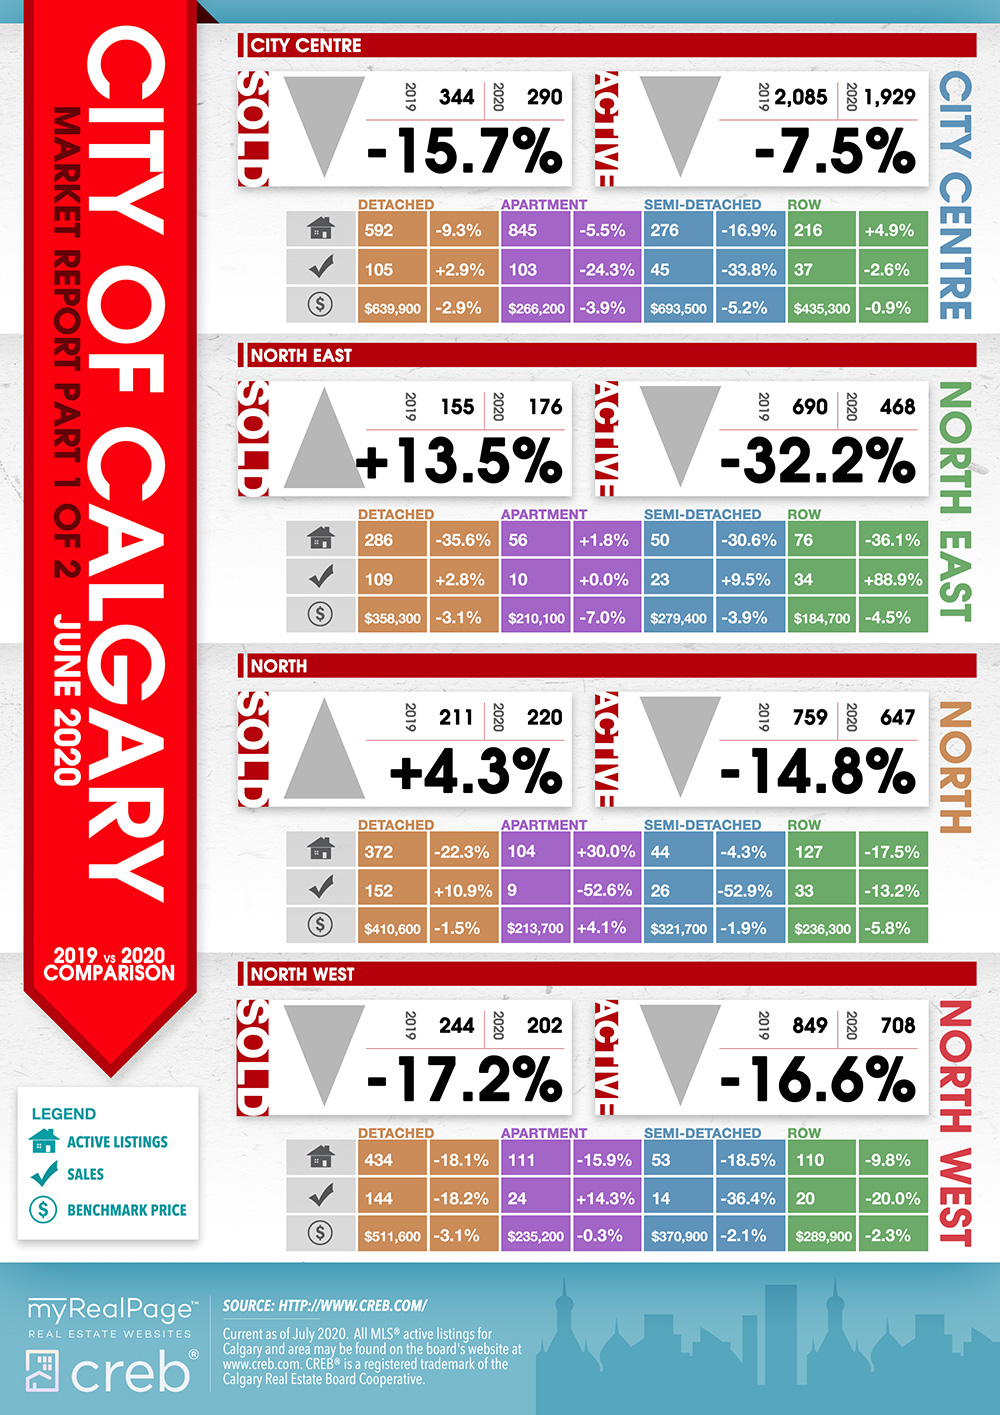
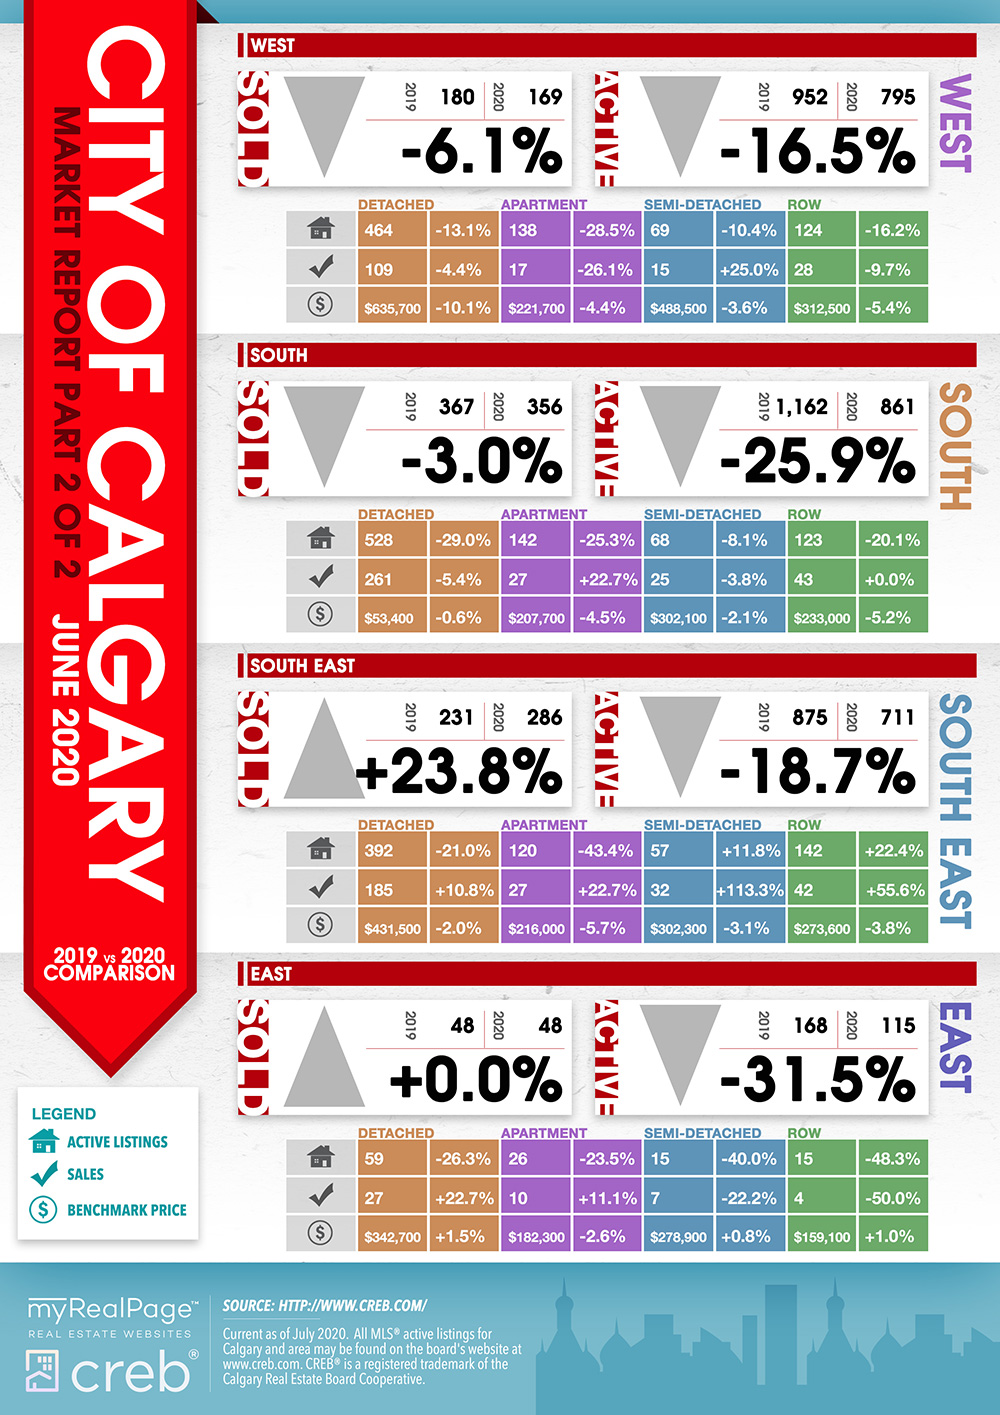
After three months where COVID-19 weighed heavily on the housing market, sales activity in June continued to trend up from the previous month, totalling 1,747 units.
Caution remains necessary, as monthly sales are nearly 2% lower than activity recorded last year. However, this represents a significant improvement compared to the past several months, where year-over-year declines exceeded 40%.
Read the full report on the CREB website!
The following data is a comparison between June 2019 and June 2020 numbers, and is current as of July 2020. For last month’s numbers, check out our previous infographic.
Or follow this link for all our CREB Infographics!
Click on the images for a larger view! (Protip: Make sure to grab the printable PDF versions, too! It fits best when printed on A4-sized sheets, AND we’ve added an area on the sheet where you can attach your business card! 🙂 )
Download Printable Version – June 2020 CREB, City of Calgary Report
Download Printable Version – June 2020 CREB, Calgary Region Report

Last Updated on July 25, 2022 by myRealPage
