INFOGRAPHICS: June 2021 VIREB Vancouver Island Market Reports

June market cools slightly but high demand continues
The blistering heat that finally gave way to slightly cooler temperatures mirrors what is happening in our housing market, as scorching real estate activity continued its cooling trend in June.
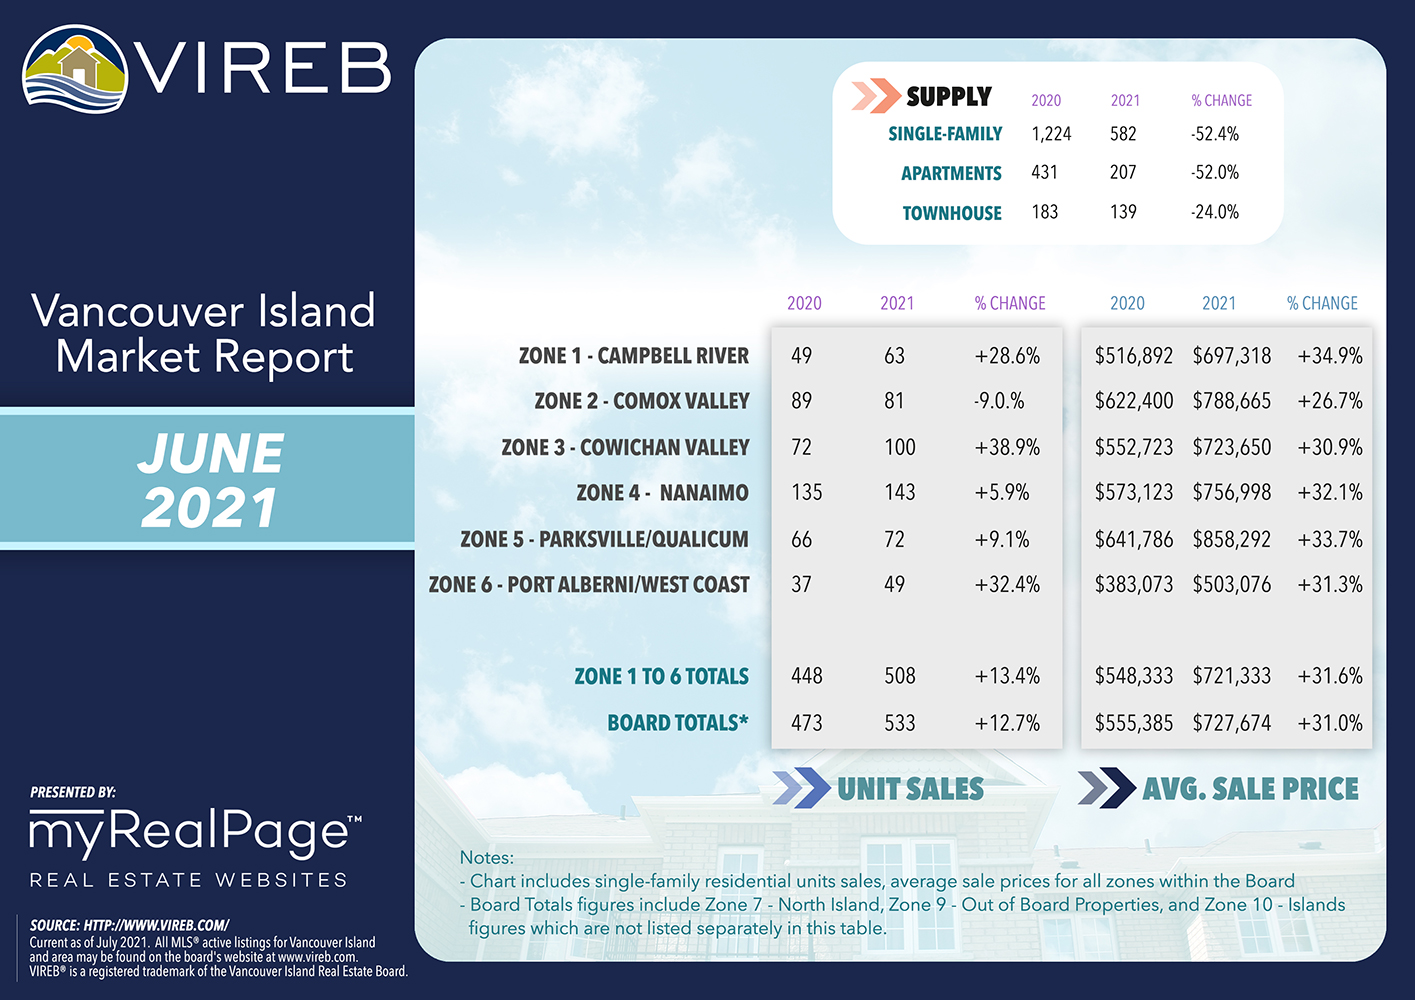
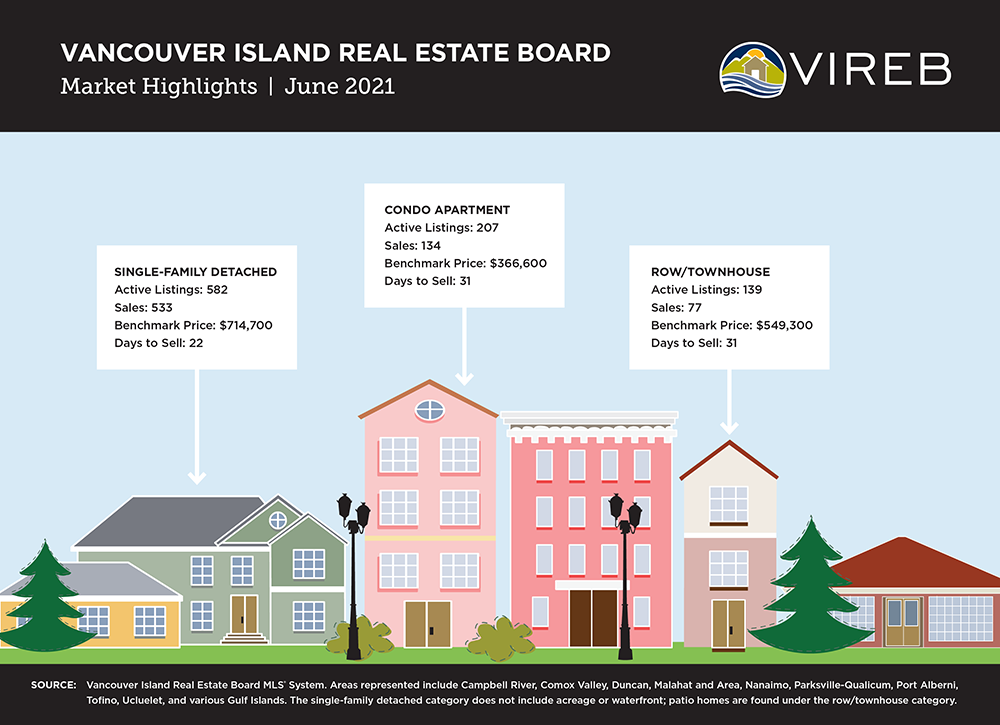
Last month, the Vancouver Island Real Estate Board (VIREB) saw sales of 533 single-family detached properties compared to 531 the previous month and 473 in June 2020. In the condo apartment category, sales dropped by 10% from May 2021 (150 to 134). Row/townhouse sales decreased by 18% from May and were 15% lower than in June 2020. Sales in the VIREB area are tracking at around 400 units more than at this time in 2016, which was our strongest market historically.
Read the full report on the VIREB website!
The following data is a comparison between June 2020 and June 2021 numbers, and is current as of July 2021. Click here to check out last month’s infographics.
You can also view all our VIREB infographics by clicking here.
Click on the images for a larger view! (Protip: Make sure to grab the printable PDF versions, too! It fits best when printed on A4-sized sheets, AND we’ve added an area on the sheet where you can attach your business card! 🙂 )
Download Printable Version – June 2021 VIREB Market Report
Last Updated on July 25, 2022 by myRealPage
