INFOGRAPHICS: March 2019 FVREB Fraser Valley, South Surrey, Etc. Market Reports

Spring is in full swing, and things are looking up over at Fraser Valley! Here are the latest market updates for areas covered by the Fraser Valley Real Estate Board (FVREB)!
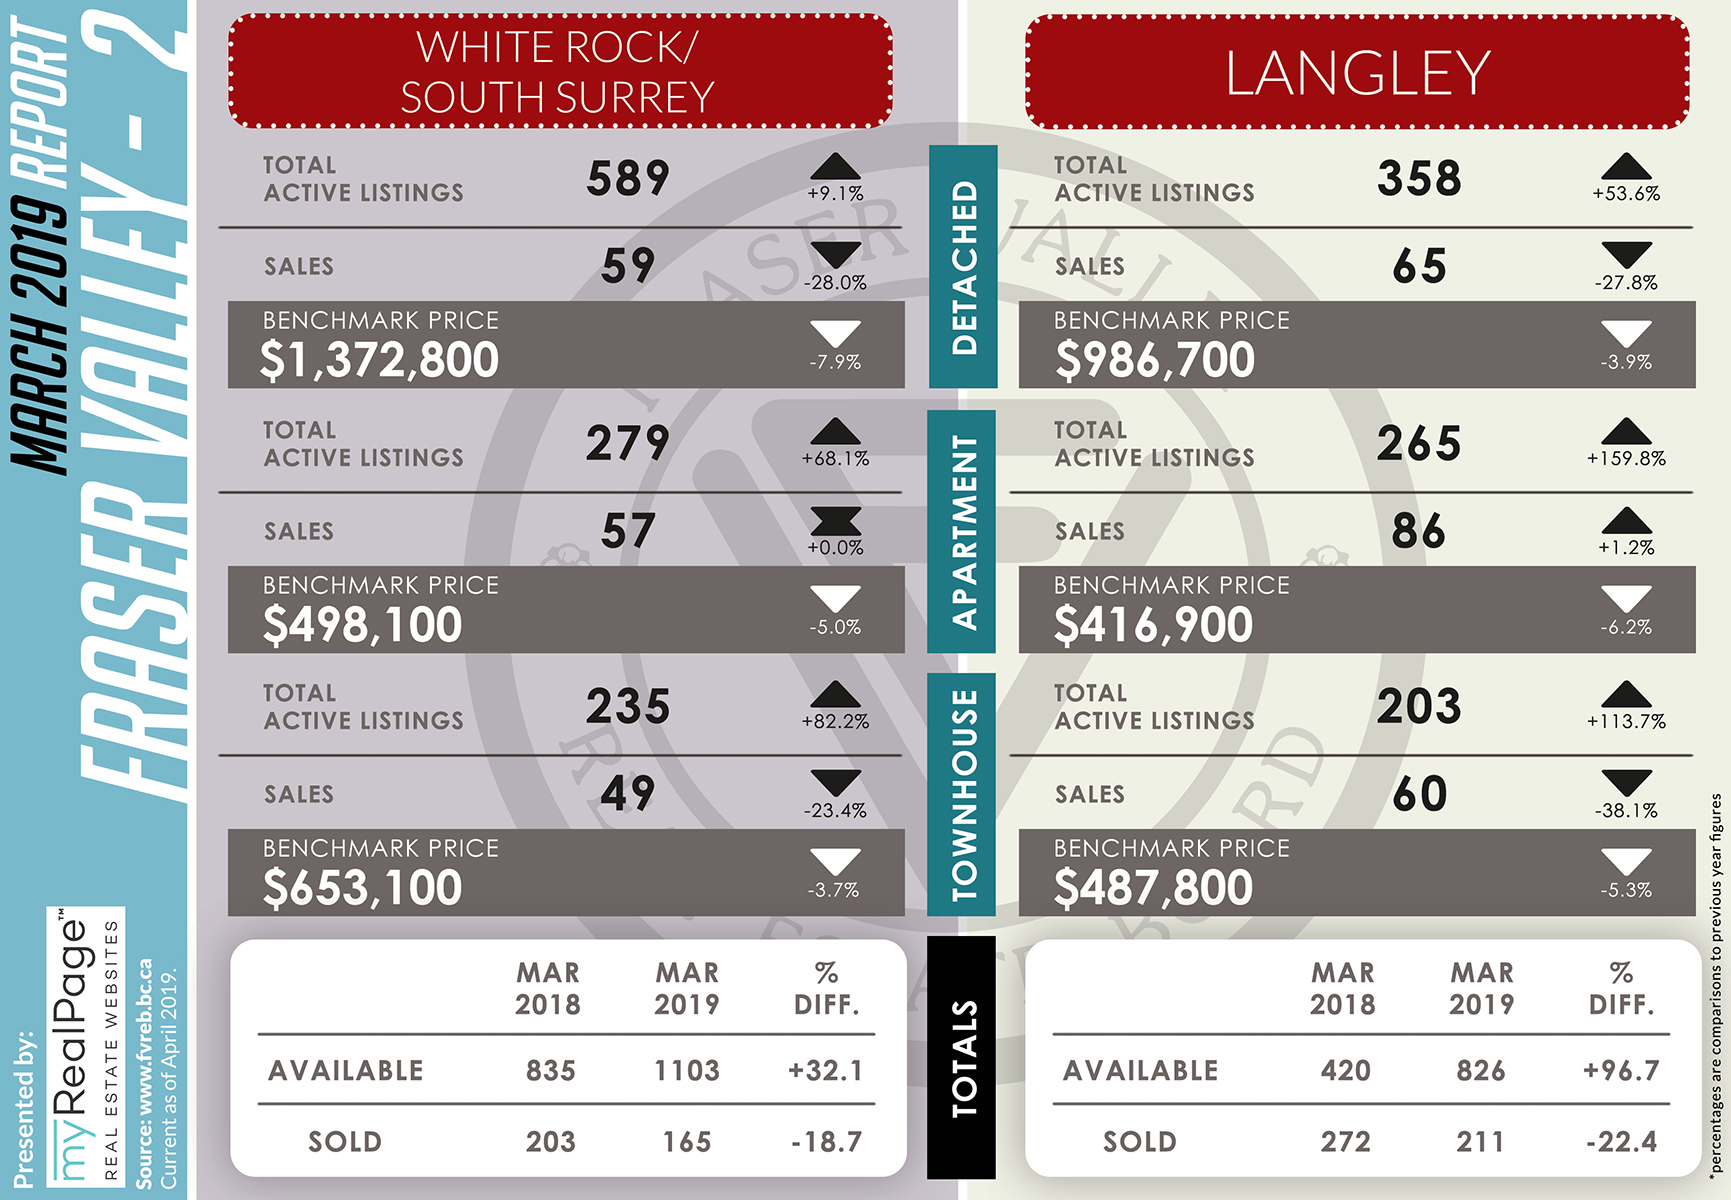
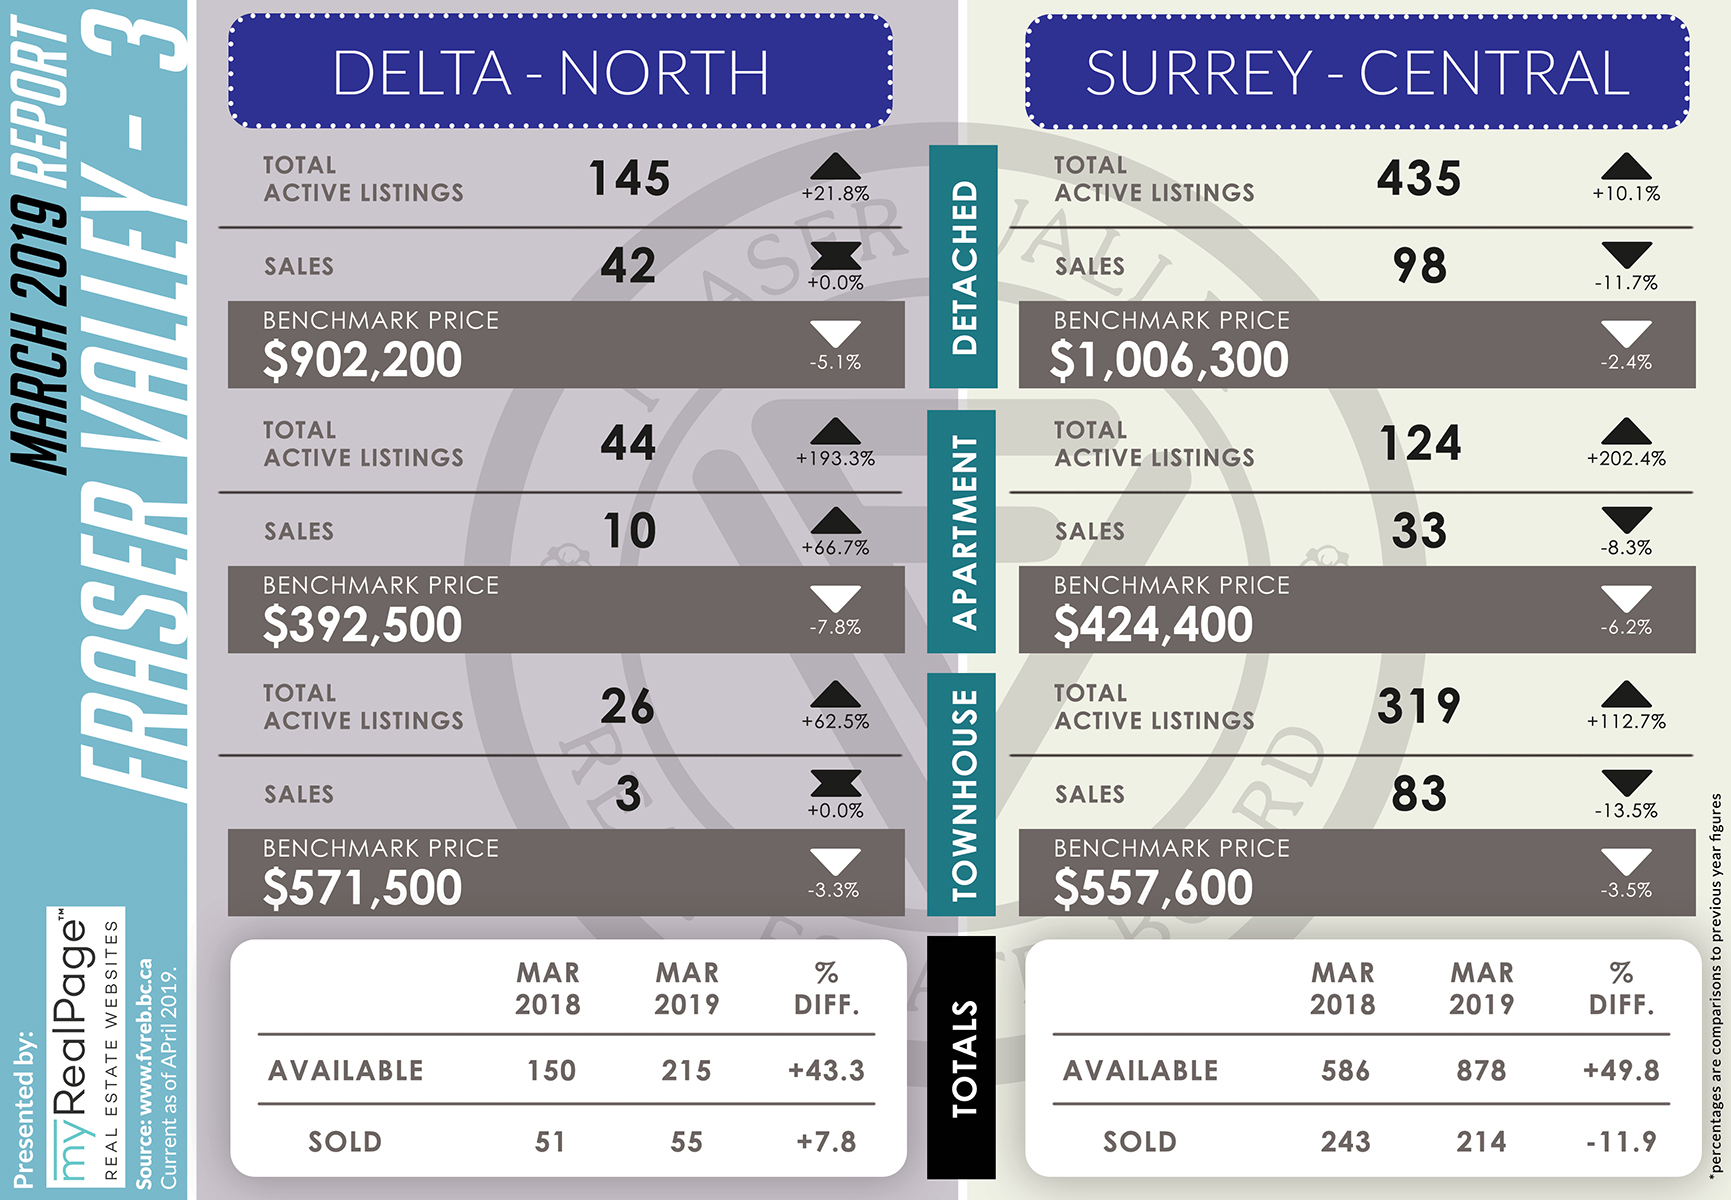
In their latest market report, it is noted that FVREB is seeing typical an increase in March sales which is typical to the season. According to the report, buyers in the Fraser Valley took advantage of the continued stability in home prices and the highest inventory levels for March since 2015.
As noted by Darin Germyn, President of the Board,
“From a buyer’s perspective, there are more opportunities available as we move deeper into spring. Many of our communities are seeing higher inventory levels, especially in the attached market with the number of available townhomes almost doubling and Fraser Valley condos more than doubling compared to last year.
One of the reasons our market has remained stable is simply due to affordability. Although prices have increased dramatically over the last ten years, during the last twelve months we’ve seen prices for all major residential property types in the Fraser Valley decrease between four and five per cent. This is good news for buyers.”
The following data is a comparison between March 2018 and March 2019 numbers, and is current as of April 2019. For last month’s report, check out our previous infographic!
Or follow this link for all our FVREB Infographics!
These infographics cover current trends in Fraser Valley neighbourhoods that are within the FVREB.
Click on the images for a larger view!
(Protip: Make sure to grab the printable PDF version, too! It fits best when printed on A4-sized sheets, AND we’ve added an area on the sheet where you can attach your business card! 🙂 )
Download Printable Version – FVREB March 2019 Market Report


Last Updated on July 25, 2022 by myRealPage
