INFOGRAPHICS: March 2019 TREB Toronto Market Reports

And just like that, it’s already April! Here are the latest real estate market updates for areas covered by the Toronto Real Estate Board (TREB)!
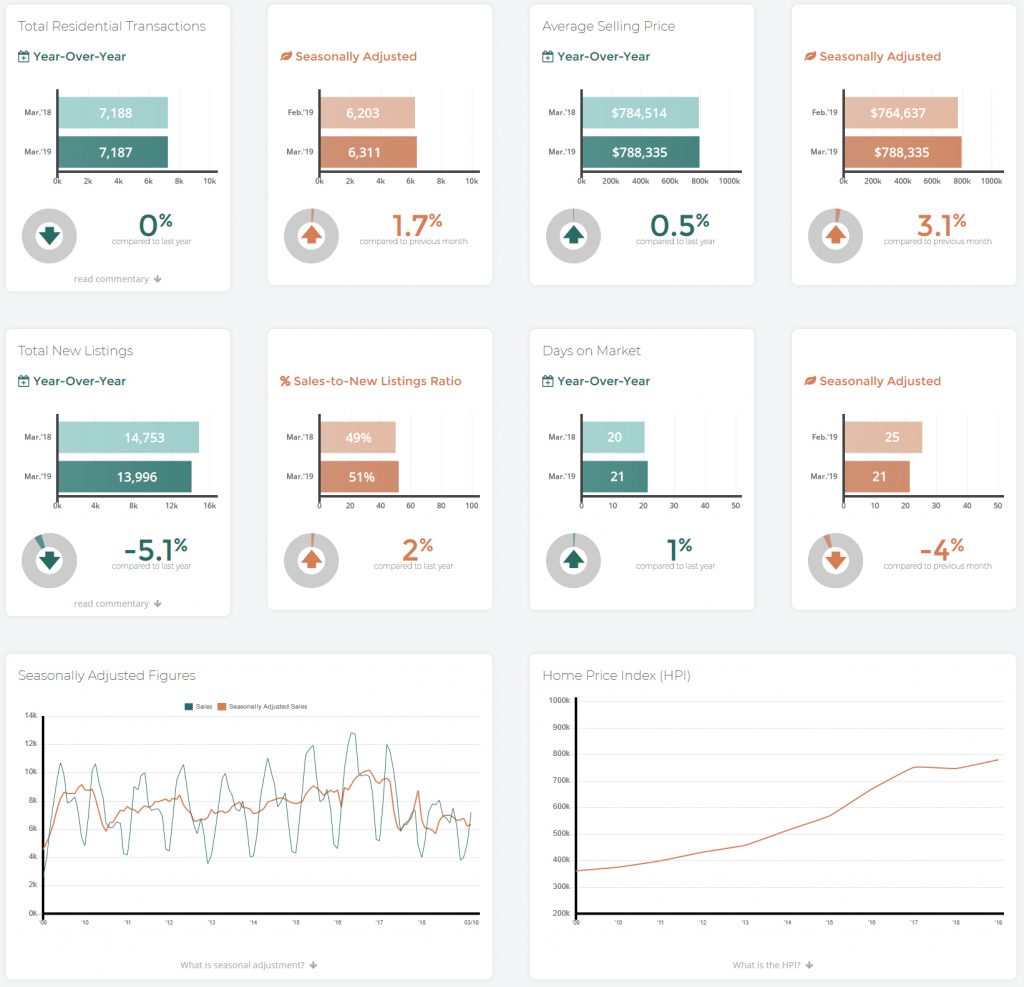
In their latest press release, TREB reports that 7,187 residential sales were processed through TREB’s MLS System in March 2019. This result was inline with 7,188 sales reported in March 2018. For the first quarter of 2019, sales were down by 1% compared to Q1 2018.
As noted by TREB President Garry Bhaura,
“The OSFI stress test continues to impact home buyers’ ability to qualify for a mortgage. TREB is still arguing that the stress test provisions and mortgage lending guidelines generally, including allowable amortization periods for insured mortgages, should be reviewed.
The supply of listings in the GTA also remains a problem. Bringing a greater diversity of ownership and rental housing online, including ‘missing middle’ home types, should be a priority of all levels of government.
TREB is happy to be taking part in the City of Toronto’s consultations for the Housing TO – 2020-2030 Action Plan, and will certainly be raising the supply issue during these discussions.”
TREB CEO John Di Michele also states,
“While the City of Toronto’s recently announced Housing TO – 2020-2030 Action Plan is exciting and commendable and TREB looks forward to contributing solutions as a Member of the External Advisory Committee, the recently proposed increase to the Municipal Land Transfer Tax on higher priced properties is problematic. As the recent City budget process showed, the MLTT is not a sustainable revenue source from which to fund municipal programs. On top of this, additional MLTT on higher priced homes could have a trickle-down effect on the supply of homes throughout the housing price continuum.”
Meanwhile, TREB Chief Market Analyst Jason Mercer also adds,
“Market conditions have remained tight enough to support a moderate pace of price growth. Despite sales being markedly lower than the record levels of 2016 and early 2017, the supply of listings has also receded. This means that in many neighbourhoods throughout the GTA, we continue to see competition between buyers for available listings, which provides a level of support for home prices.”
UPDATE: In January 2020, TREB has since rebranded to TRREB, the Toronto Regional Real Estate Board.
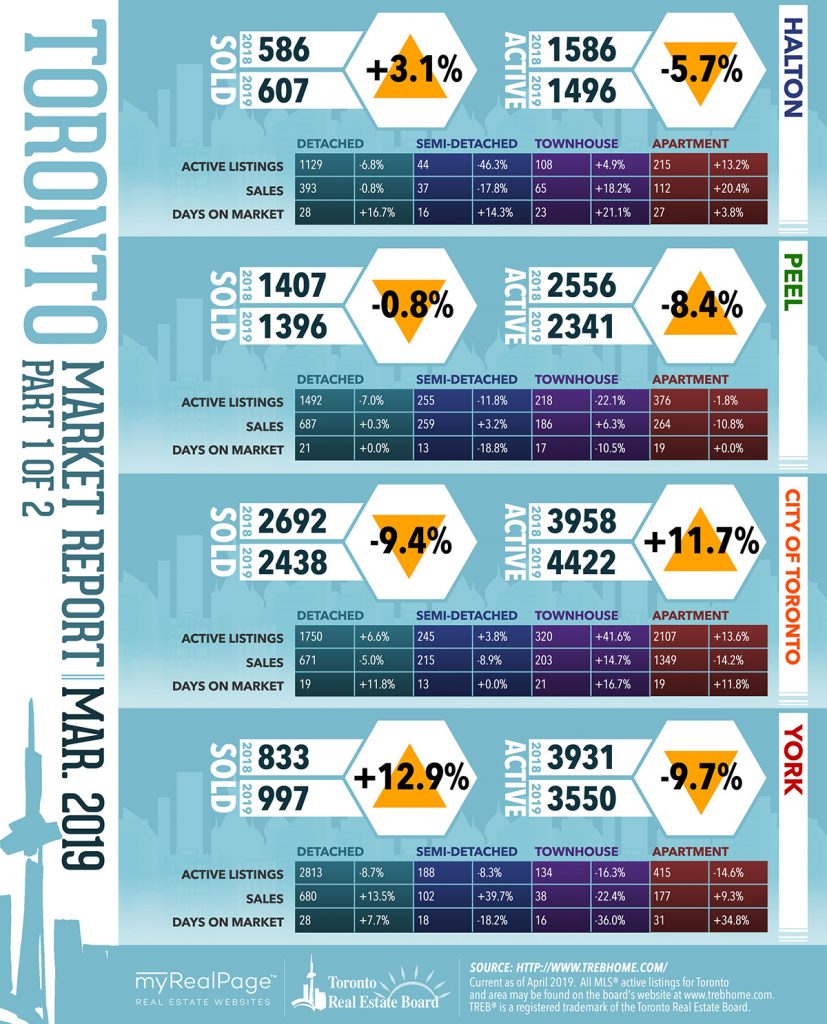
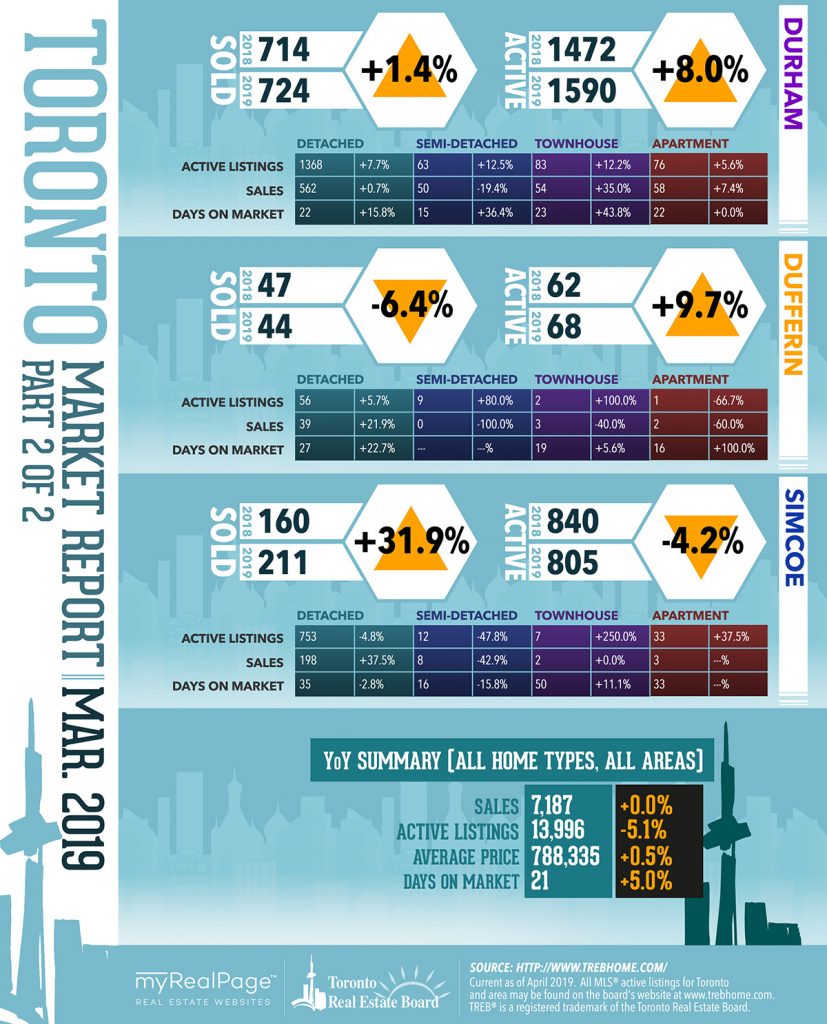
The following data is a comparison between March 2018 and March 2019 numbers, and is current as of April 2019. For last month’s numbers, check out our previous infographic!
Or follow this link for all our TREB Infographics!
Click on the images for a larger view!
(Protip: Make sure to grab the printable PDF versions, too! It fits best when printed on A4-sized sheets, AND we’ve added an area on the sheet where you can attach your business card! 🙂 )
Download Printable Version – March 2019 TREB, Toronto Market Report

(Image Source: TREBhome.com)
Last Updated on July 25, 2022 by myRealPage


