INFOGRAPHICS: March 2020 CREB City And Region Market Reports

These are challenging times, and we hope that everyone is healthy and well. For now, here are the latest housing market updates for areas covered by the Calgary Real Estate Board (CREB)!
As noted in their latest market report, after a strong start to 2020, economic conditions have dramatically changed, as COVID-19 is impacting all aspects of society.
The economic impact is starting to be felt across many industries. This includes the housing market.
March sales activity started the month strong, but quickly changed, as concerns regarding the spread of COVID-19 brought about social distancing measures. This had a heavy impact on businesses and employment.
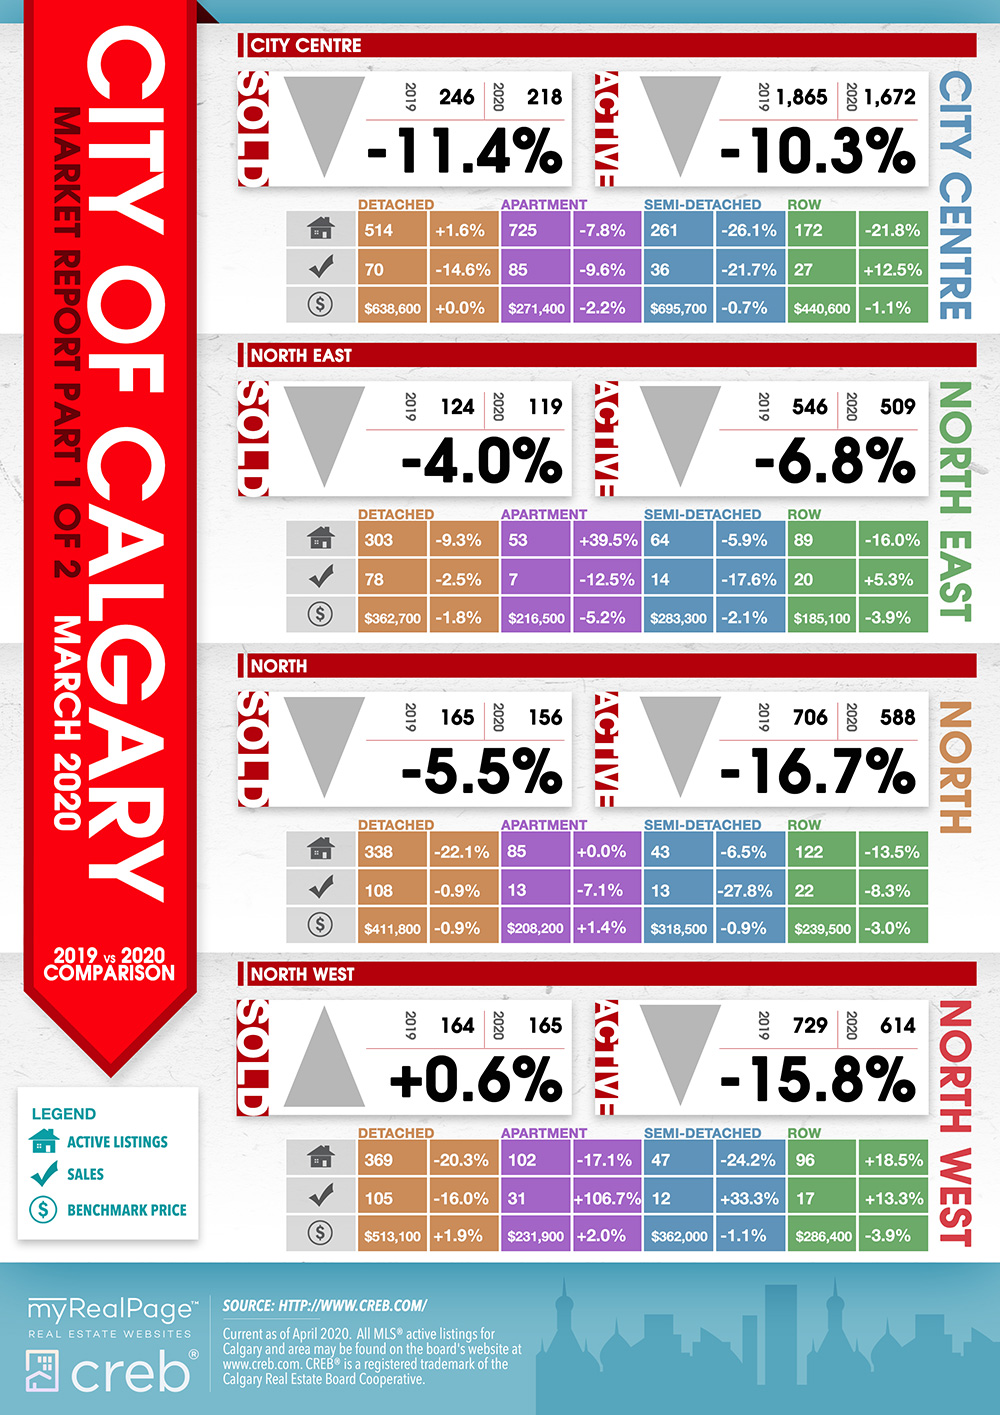
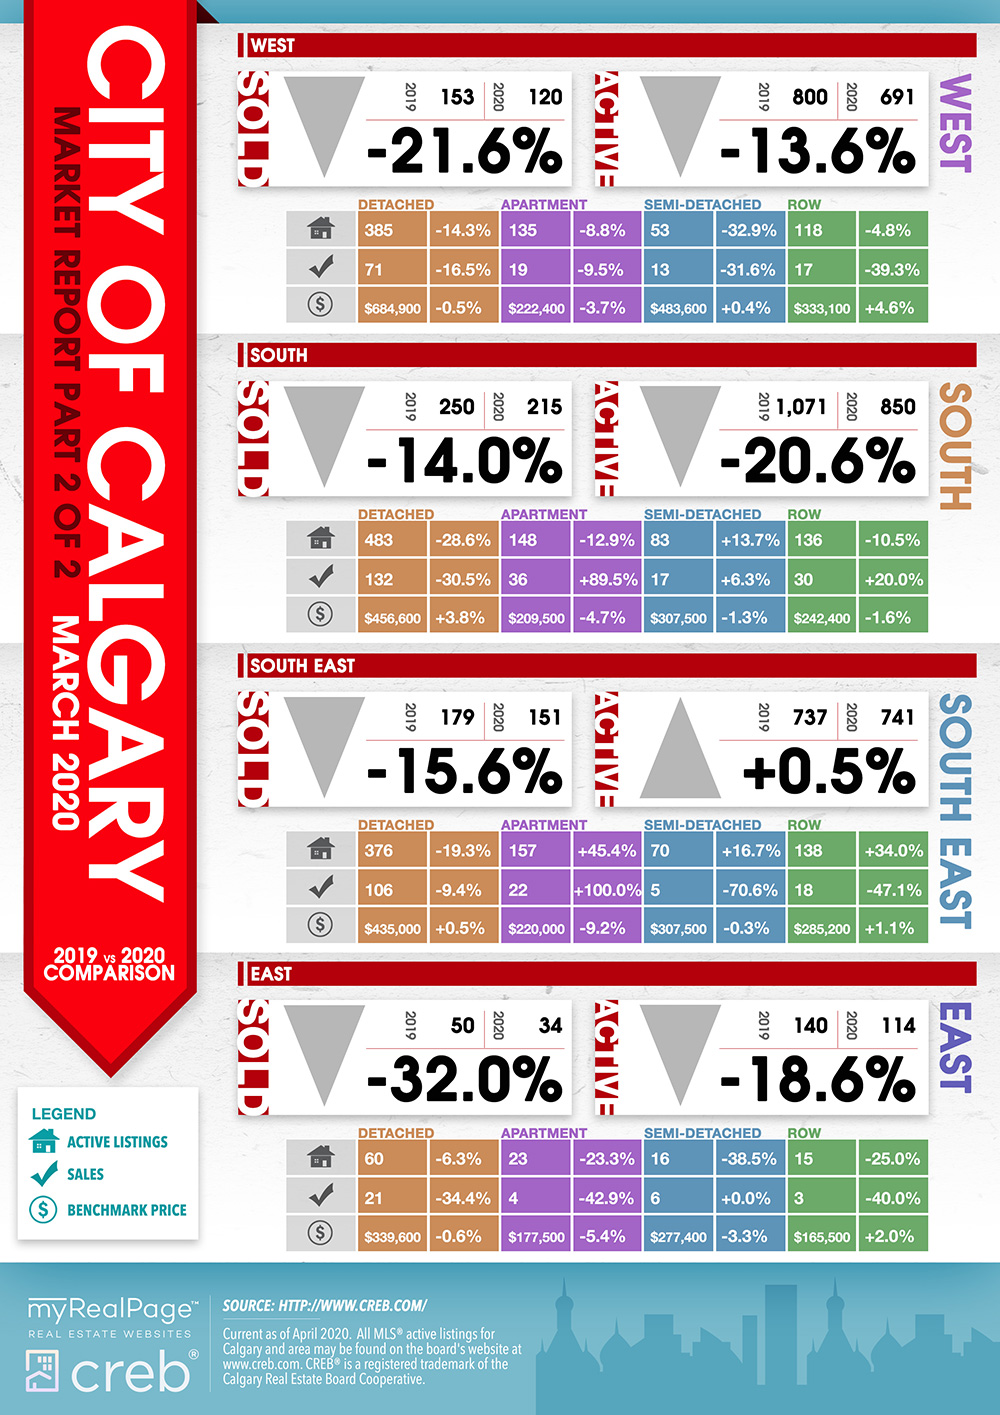
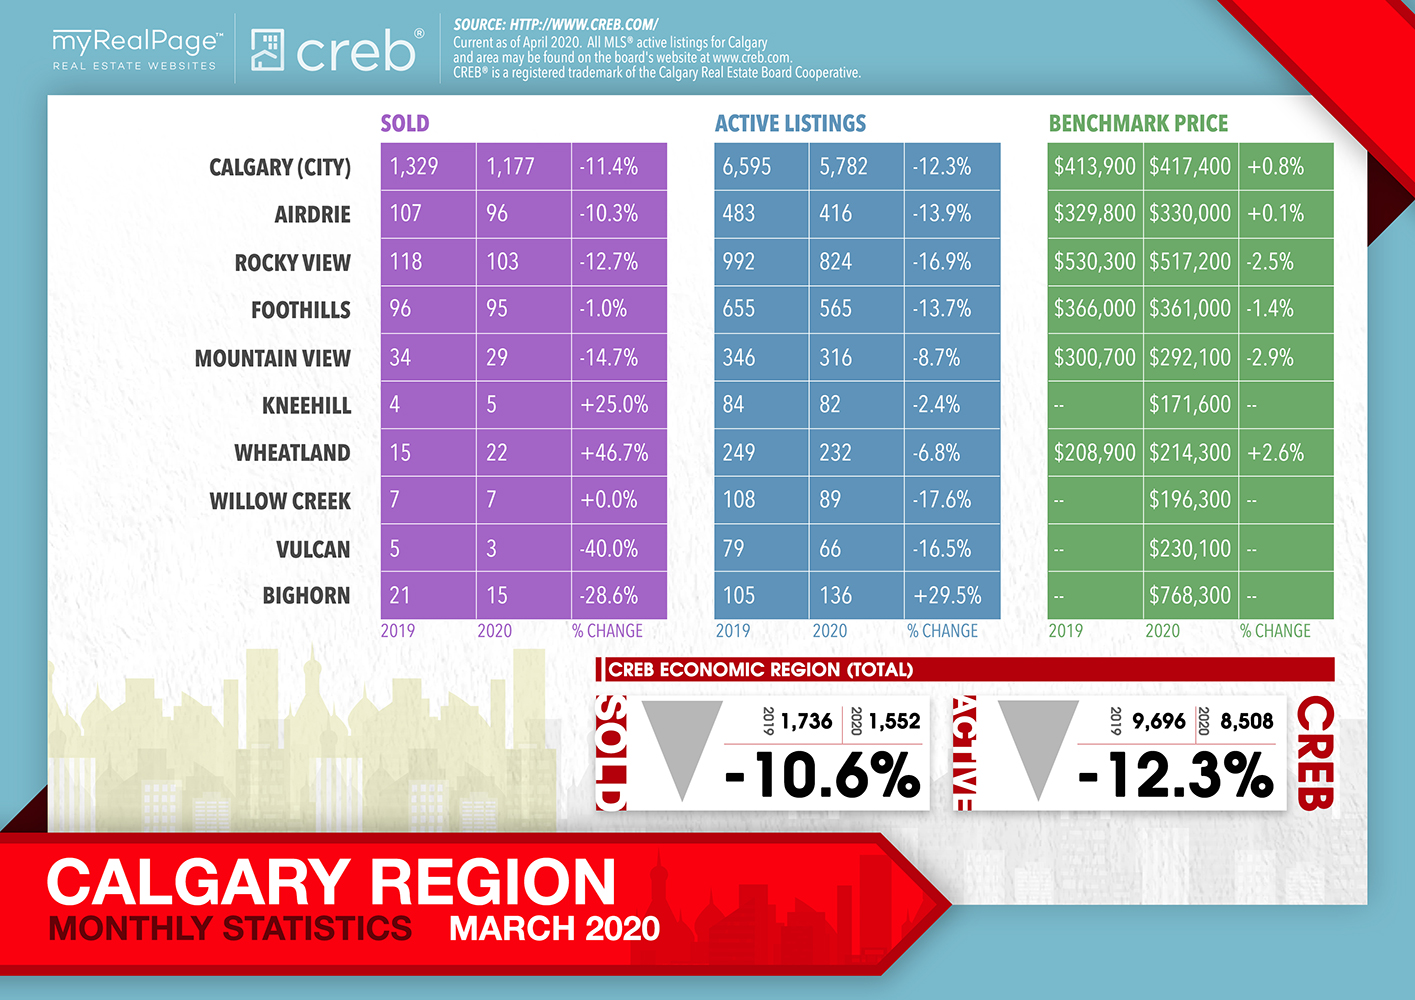
By the end of March, sales activity had fallen 11% compared to last year. This is 37% lower than long-term averages. The drop in sales pushed March levels to the lowest recorded since 1995.
New listings dropped by 19% this month. This decline in new listings compared to sales caused supply levels to ease and helped prevent a larger increase in oversupply. Overall, the months of supply remain just below five months, similar to levels recorded last year.
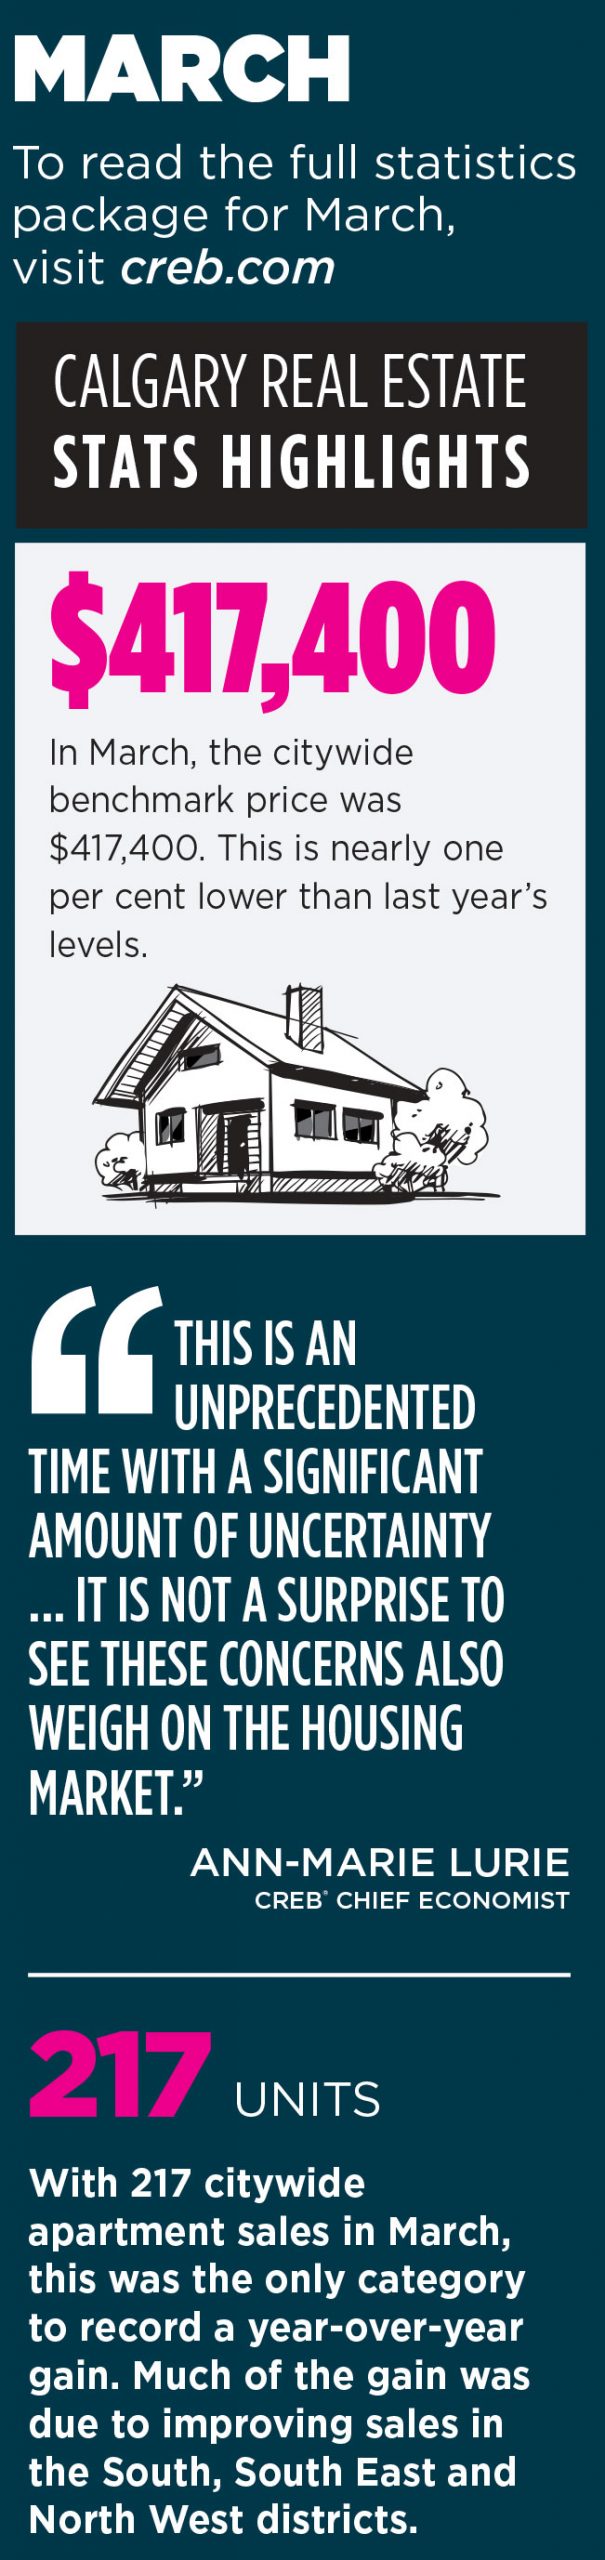
Prices were already forecasted to ease this year due to oversupply in our market. In March, the citywide benchmark price was $417,400. This is nearly 1% lower than last year’s levels. The reduction in both sales and new listings should help prevent significant price declines in our market.
However, price declines will likely be higher than originally expected due to the combined impact of the pandemic and energy sector crisis.
As noted by CREB® chief economist Ann-Marie Lurie,
“This is an unprecedented time with a significant amount of uncertainty coming from both the wide impact of the pandemic and dramatic shift in the energy sector. It is not a surprise to see these concerns also weigh on the housing market.
The impact on the housing market will likely persist over the next several quarters. However, measures put in place by the government to help support homeowners through this time of job and income loss will help prevent more significant impacts in the housing market.”
The following data is a comparison between March 2019 and March 2020 numbers, and is current as of April 2020. For last month’s numbers, check out our previous infographic.
Or follow this link for all our CREB Infographics!
Click on the images for a larger view!
(Protip: Make sure to grab the printable PDF versions, too! It fits best when printed on A4-sized sheets, AND we’ve added an area on the sheet where you can attach your business card! 🙂 )
Download Printable Version – March 2020 CREB, City of Calgary Report
Download Printable Version – March 2020 CREB, Calgary Region Report
(Image Source: CREBnow.com)
Last Updated on July 25, 2022 by myRealPage
