INFOGRAPHICS: March 2020 RAE Edmonton Market Reports

It’s been a challenging few weeks, and we hope that everyone is healthy and well, given the current circumstances. For now, here are this month’s market updates for areas and neighbourhoods under the REALTORS Association of Edmonton (RAE)!
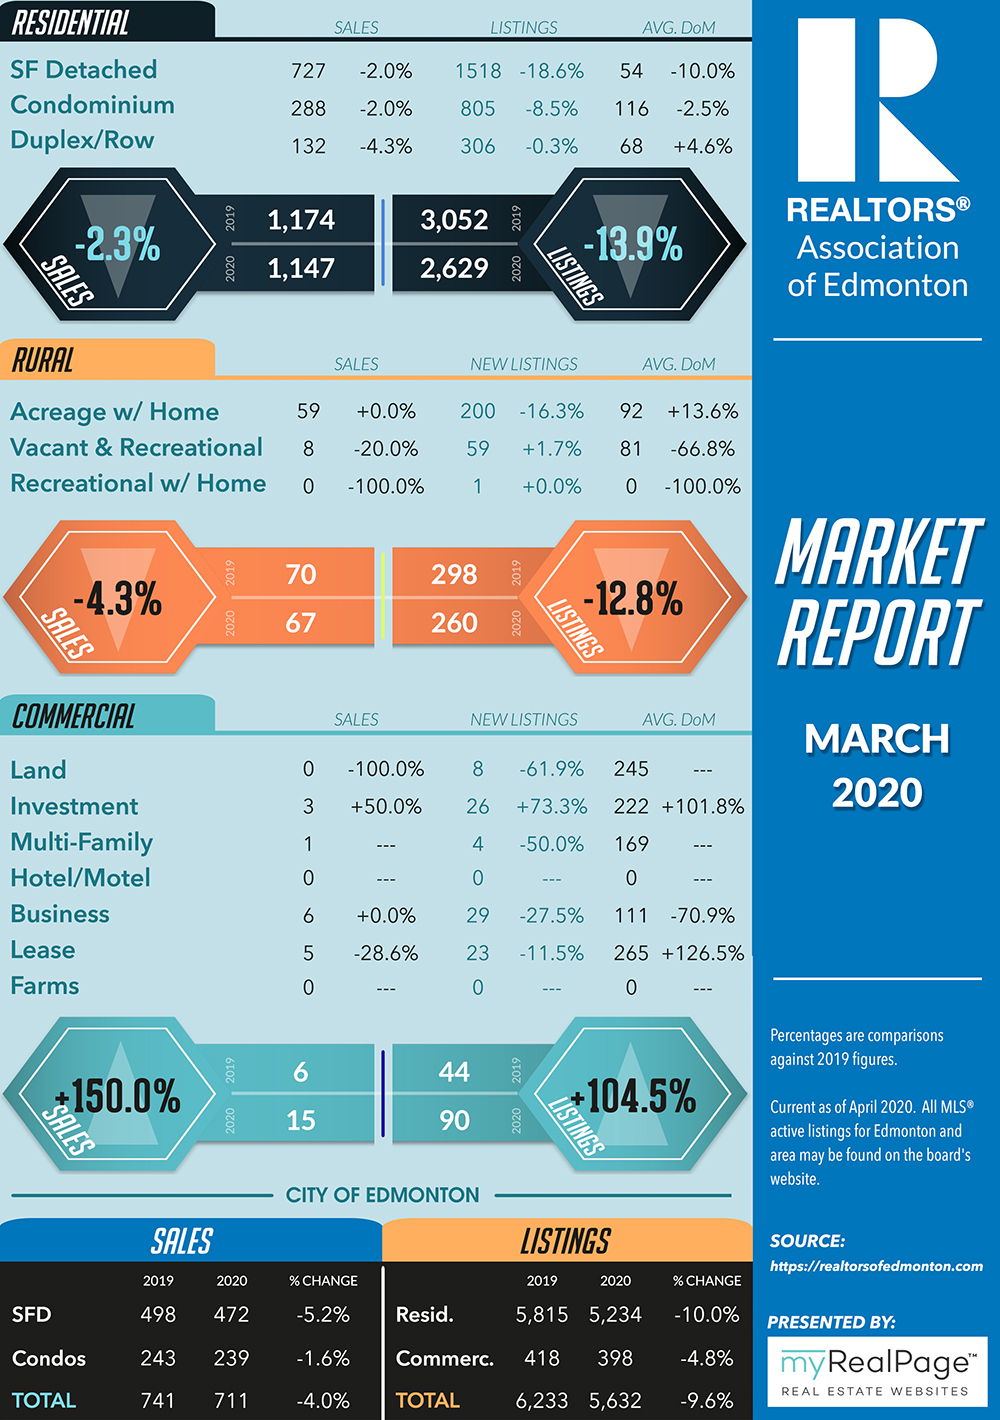
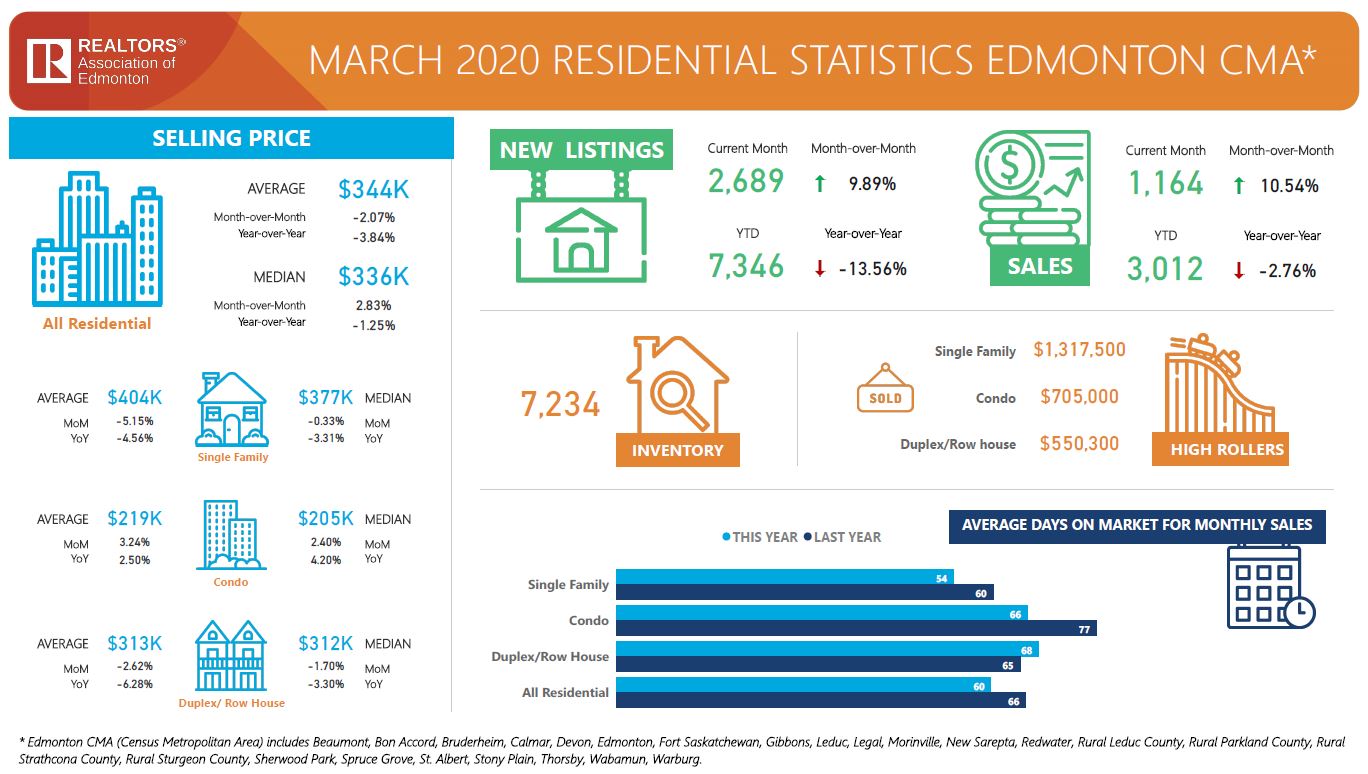
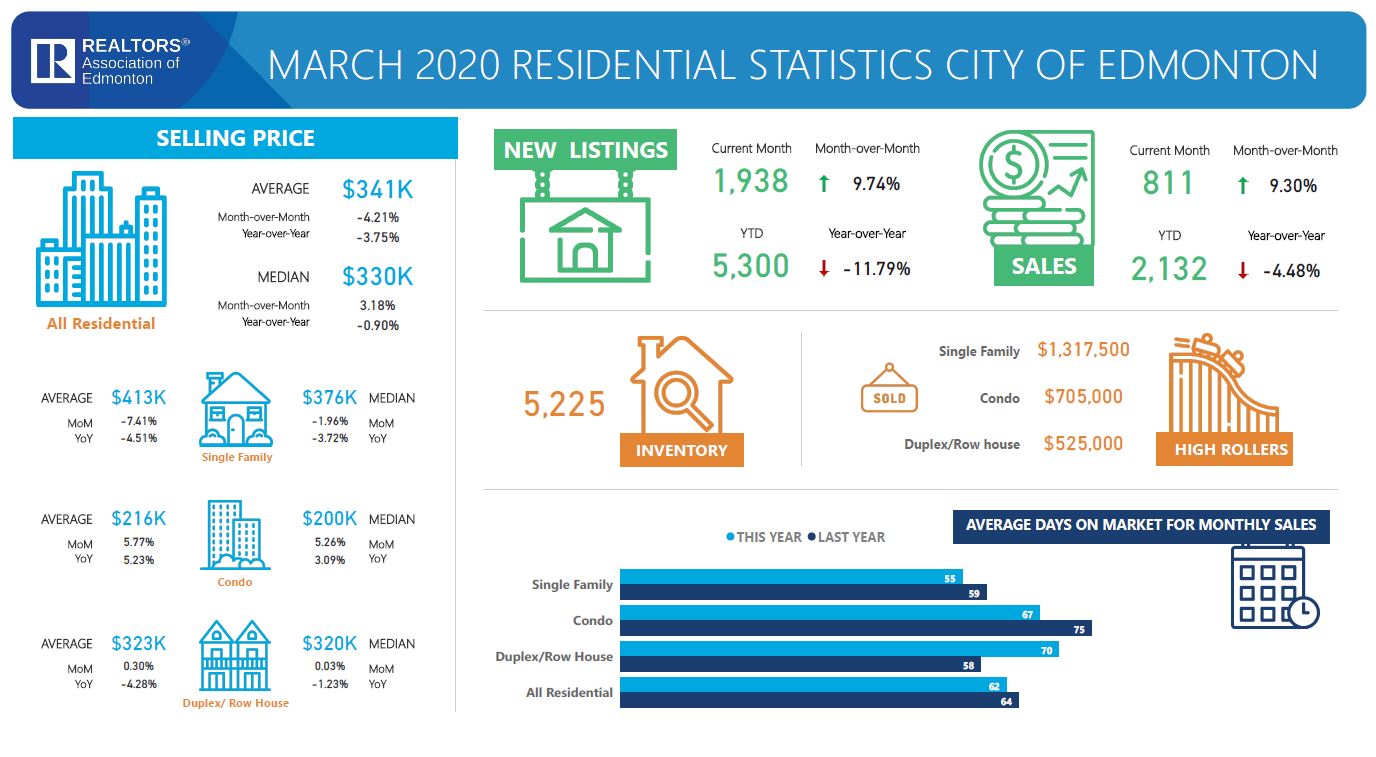
As noted in their latest market release, total residential unit sales in the Edmonton Census Metropolitan Area (CMA) real estate market for March 2020 decreased 2.59% compared to March 2019 and increased 10.31% from February 2020. The number of new residential listings is down year over year, decreasing 14.01% from March 2019. New residential listings are up month over month, increasing 7.72% from February 2020. Overall inventory in the Edmonton CMA fell 12.66% from March of last year but increased 5.75% from February 2020.
For the month of March, single family home unit sales are down 2.02% from March 2019 and up 13.59% from February 2020. Condo unit sales decreased 2.04% from March 2019 and increased 1.41% from February 2020.
All residential average prices are down to $343,951, a 3.78% decrease from March 2019, and down 1.97% from February 2020. Single family homes sold for an average of $404,344, a 4.64% year-over-year decrease from March 2019, and a 5.13% decrease from February 2020. Condominiums sold for an average of $218,613, a 2.50% increase year-over-year, and prices are up 2.87% compared to February 2020. Duplex prices dropped 6.28% from March 2019, selling at $313,443, which was a 2.62% decrease from February 2020.
According to REALTORS® Association of Edmonton Chair Jennifer Lucas,
“The Edmonton market prices have declined in March and we saw a slight decrease in year-over-year unit sales. Of course, with the outbreak of a global pandemic and a hard hit to Alberta’s oil and gas sector, this type of market slowing is not surprising. There have been less sales of single family homes, condos and duplexes than in March of last year. Single family home pricing decreased 4.64%, duplexes are down 6.28%, and condos are up 2.50% year-over-year.”
The following data is a comparison between March 2019 and March 2020 numbers, and is current as of April 2020.
For last month’s numbers, check out our previous RAE infographic!
You can also click here to view all our Edmonton inforgraphics.
Click on the images for a larger view!
(Protip: Make sure to grab the printable PDF versions, too! It fits best when printed on A4-sized sheets, AND we’ve added an area on the sheet where you can attach your business card! 🙂 )
Download Printable Version – March 2020 RAE, Edmonton Report
(Image source: RAE website)
(Image source: RAE website)
Last Updated on July 25, 2022 by myRealPage
