INFOGRAPHICS: March 2022 VIREB Vancouver Island Market Reports

INVENTORY INCHING UP BUT STILL FAR FROM IDEAL
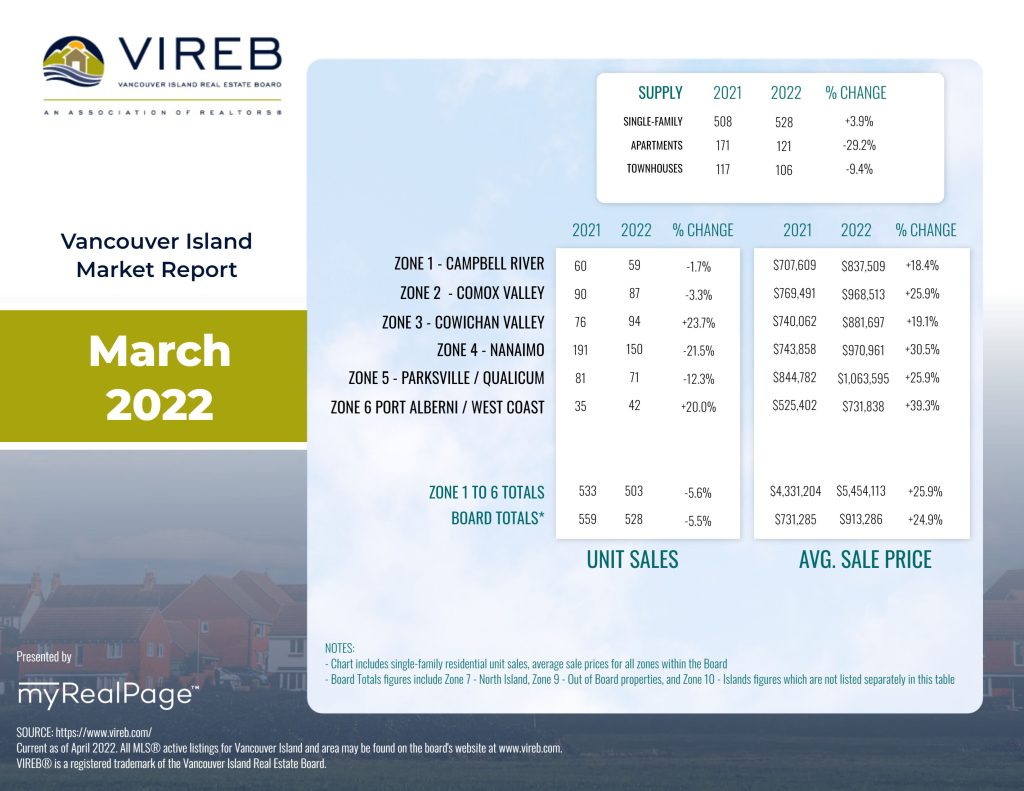
Inventory in the Vancouver Island Real Estate Board (VIREB) area is slowly inching up but is still far from ideal. Active listings of single-family homes rose by nine per cent from March 2021 but increased by 60 per cent from February. VIREB’s inventory of condo apartments in March dipped by 13 per from one year ago but increased by 28 per cent from one month ago.
Row/townhouse inventory dropped by 15 per cent year over year but was up by 50 per cent from February.
By category, 528 single-family homes sold on the MLS® System in March, a six per cent decrease from one year ago and up by 49 per cent from February. There were 121 condo apartment sales last month compared to 132 one year ago, a decline of eight per cent year over year but a nine per cent increase from the previous month. In the row/townhouse category, 106 units sold in March compared to 124 one year ago, a 15 per cent decrease. However, sales did rise by 18 per cent from February.
Read the full report on VIREB website!
The following data is a comparison between March 2022 and March 2021 numbers, and is current as of March 2022. Click here to check out last month’s infographics.
You can also view all our VIREB infographics by clicking here.
Download Printable Version – March 2022 VIREB Market Report
Last Updated on July 25, 2022 by myRealPage


