INFOGRAPHICS: March 2023 REBGV Greater Vancouver Market Reports

Spring brings price growth while new listings remain dormant
Home prices across Metro Vancouver’s1 housing market showed modest increases in March, while new listings remained below long-term historical averages.
March data also indicates home sales are making a stronger than expected spring showing so far, despite elevated borrowing costs.
The Real Estate Board of Greater Vancouver (REBGV) reports that residential home sales in the region totalled 2,5352 in March 2023, a 42.5 per cent decrease from the 4,405 sales recorded in March 2022, and 28.4 per cent below the 10-year seasonal average (3,540).
The MLS® Home Price Index composite benchmark price for all residential properties in Metro Vancouver is currently $1,143,900. This represents a 9.5 per cent decrease over March 2022 and a 1.8 per cent increase compared to February 2023.
Read the full report on the REBGV website!
The following data is a comparison between March 2023 and March 2022 numbers, and is current as of April 2023. For last month’s update, you can check out our previous post!
Or follow this link for all our REBGV Infographics!
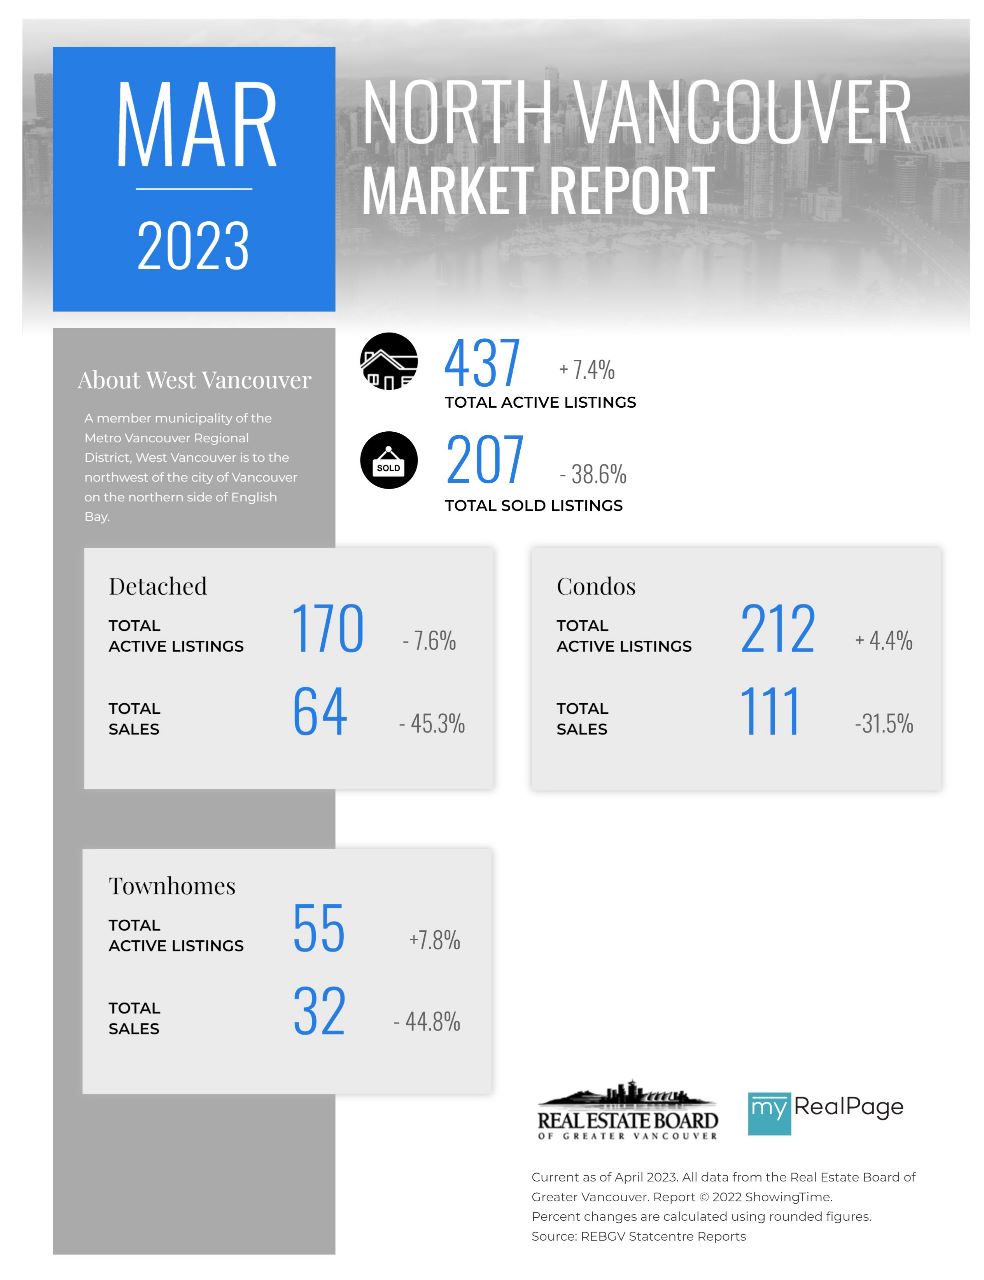
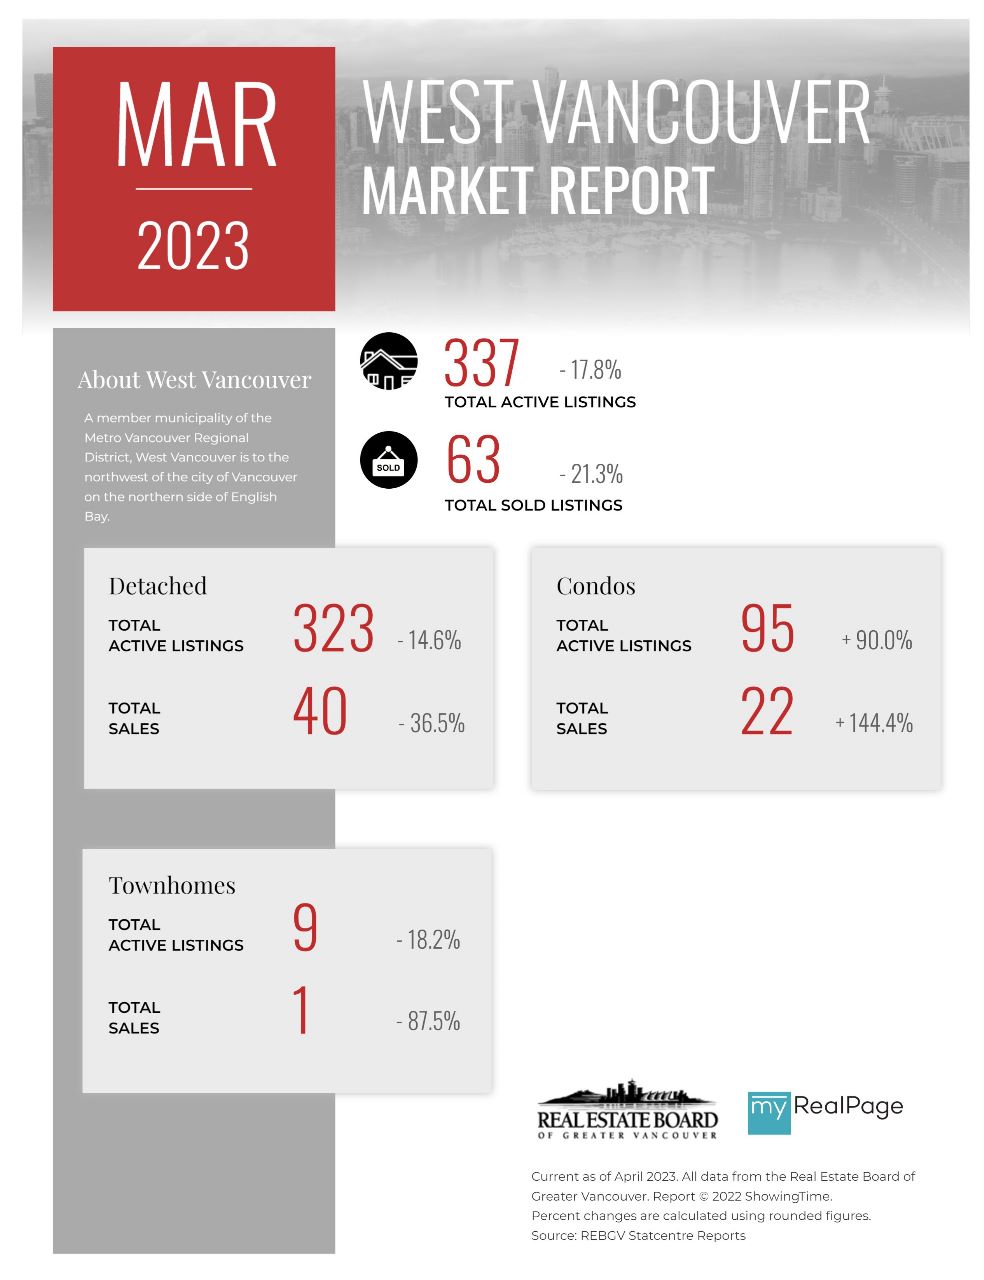
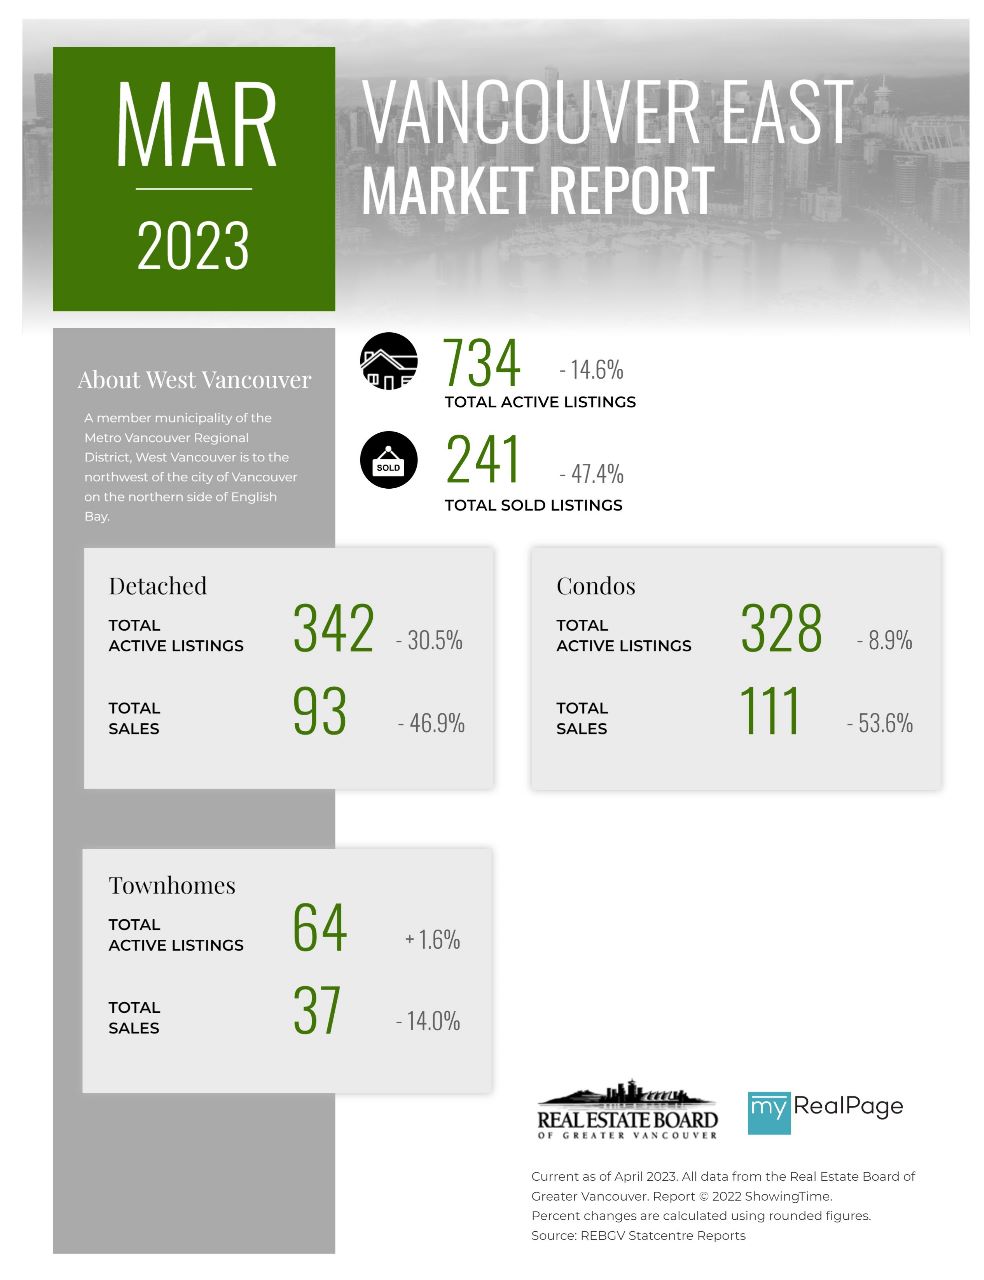
These infographics cover current trends in North Vancouver, West Vancouver, Vancouver East, and Vancouver West. Click on the images for a larger view!
Printable Version – REBGV March 2023 Data Infographic Report North Vancouver
Printable Version – REBGV March 2023 Data Infographics Report West Vancouver
Printable Version – REBGV March 2023 Data Infographics Report Vancouver West
Printable Version – REBGV March 2023 Data Infographics Report Vancouver East
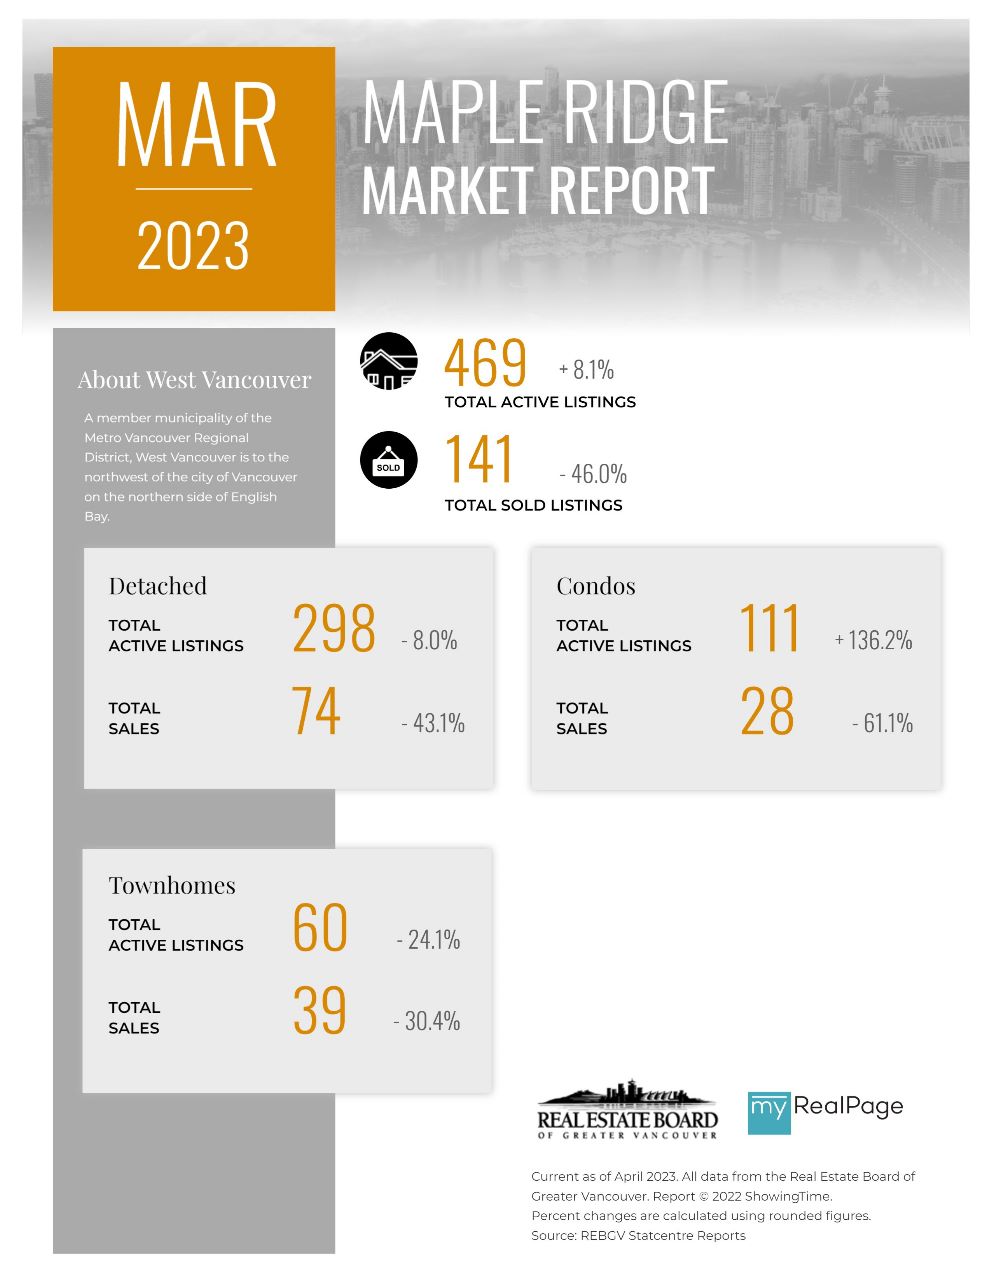
Printable Version – REBGV March 2023 Data Infographic Report Maple Ridge
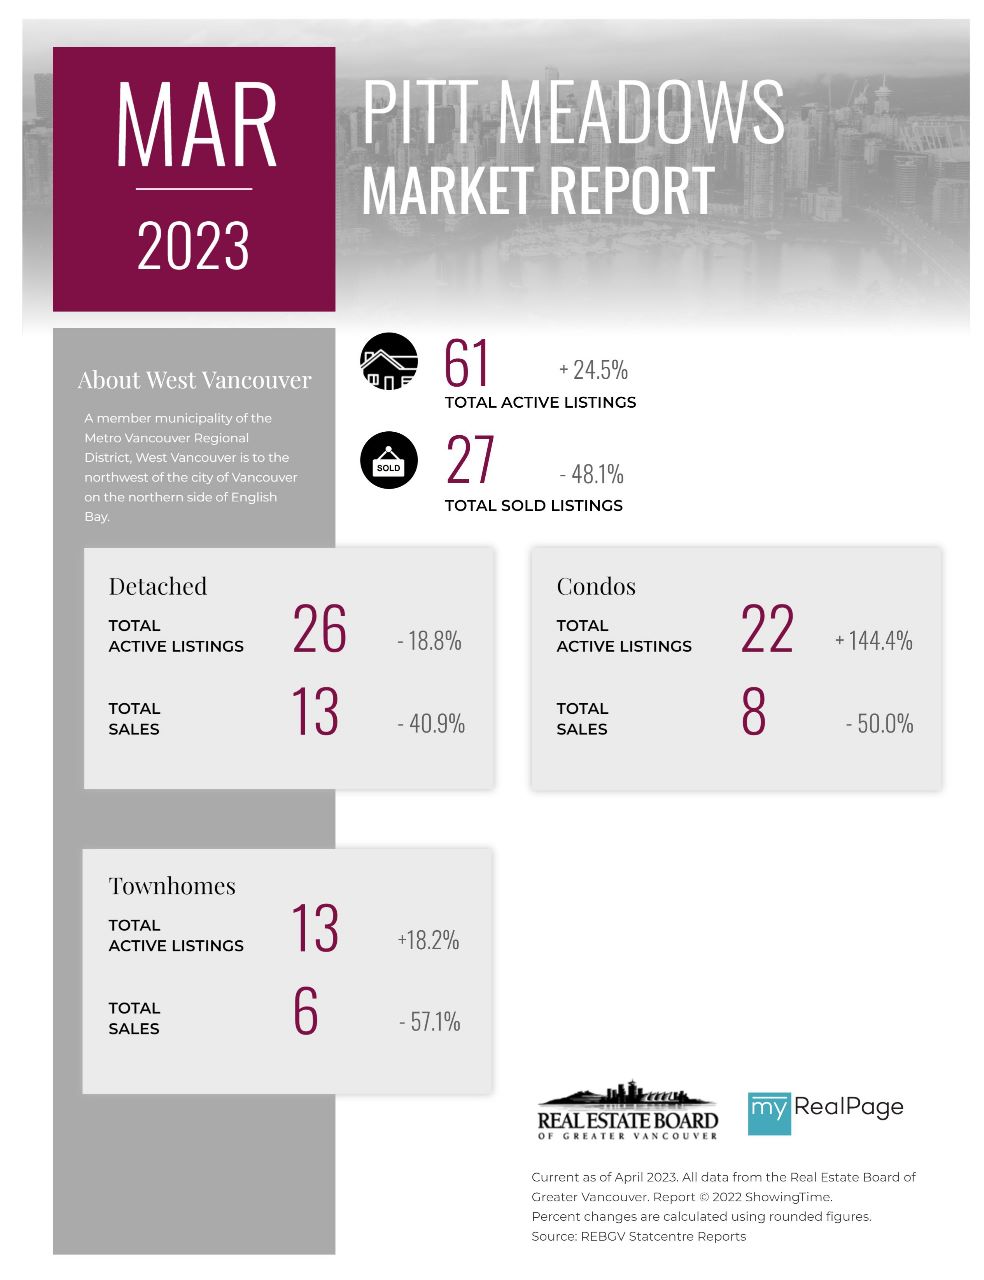
Printable Version – REBGV March 2023 Data Infographics Report Pitt Meadows
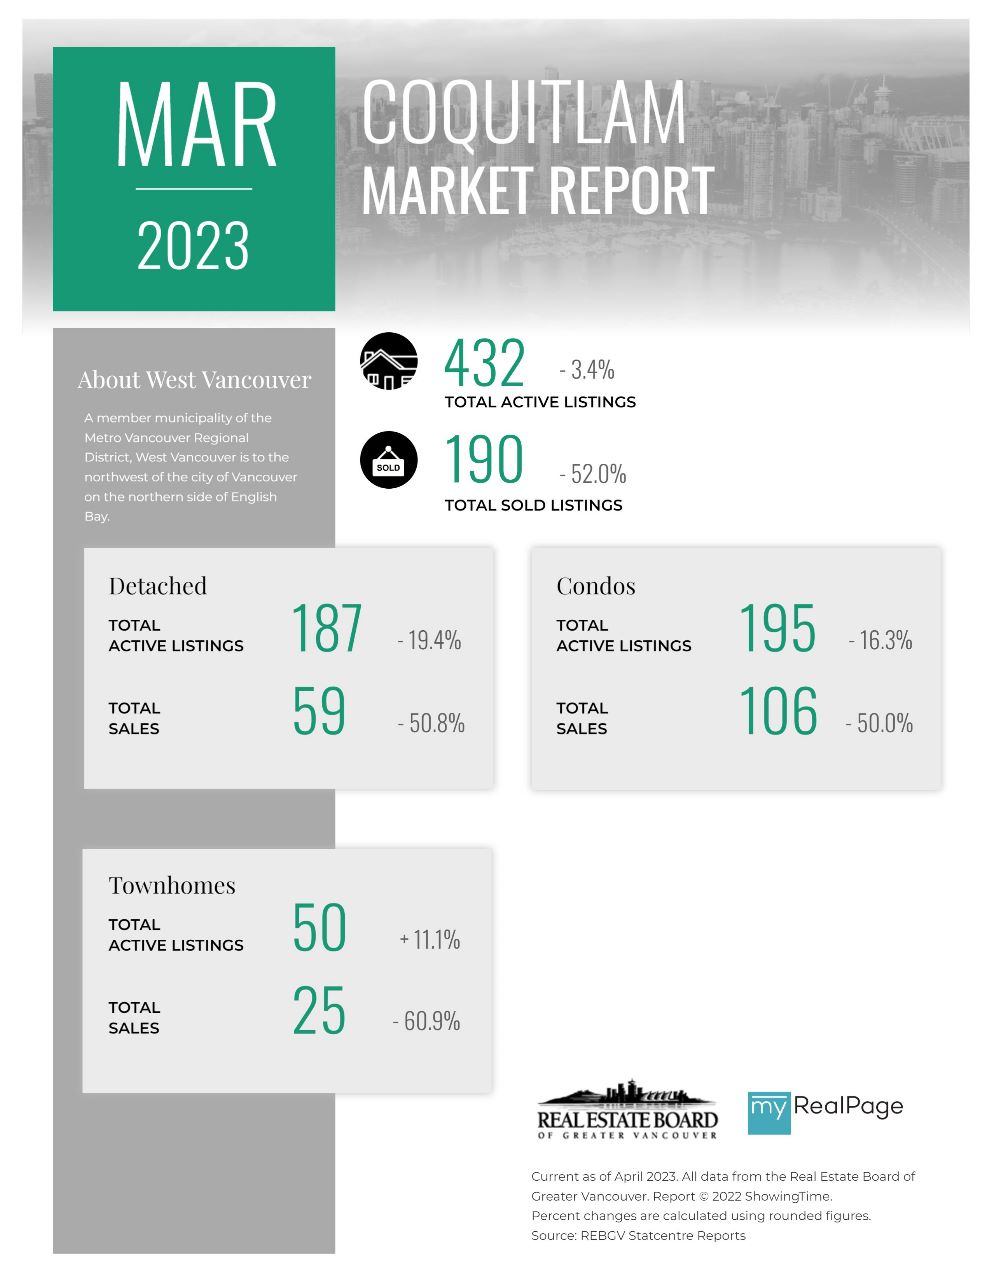
Printable Version – REBGV March 2023 Data Infographics Report Coquitlam
Printable Version – REBGV March 2023 Data Infographics Report Port Coquitlam


Last Updated on May 8, 2023 by myRealPage
