INFOGRAPHICS: February 2023 REBGV Greater Vancouver Market Reports

Below average home sales allow inventory to inch upwards
February listing data show a continued reluctance among prospective home sellers to engage in Metro Vancouver’s housing market, leading to below-average sales activity. With sales remaining well-below historical norms, the number of available homes for sale in the region have continued inching upwards.
The Real Estate Board of Greater Vancouver (REBGV) reports that residential home sales in the region totalled 1,808 in February 2023, a 47.2 per cent decrease from the 3,424 sales recorded in February 2022, and a 76.9 per cent increase from the 1,022 homes sold in January 2023.
Last month’s sales were 33 per cent below the 10-year February sales average.
Read the full report on the REBGV website!
The following data is a comparison between February 2023 and February 2022 numbers, and is current as of March 2023. For last month’s update, you can check out our previous post!
Or follow this link for all our REBGV Infographics!
These infographics cover current trends in North Vancouver, West Vancouver, Vancouver East, and Vancouver West. Click on the images for a larger view!
Printable Version – REBGV February 2023 Data Infographic Report North Vancouver
Printable Version – REBGV February 2023 Data Infographics Report West Vancouver
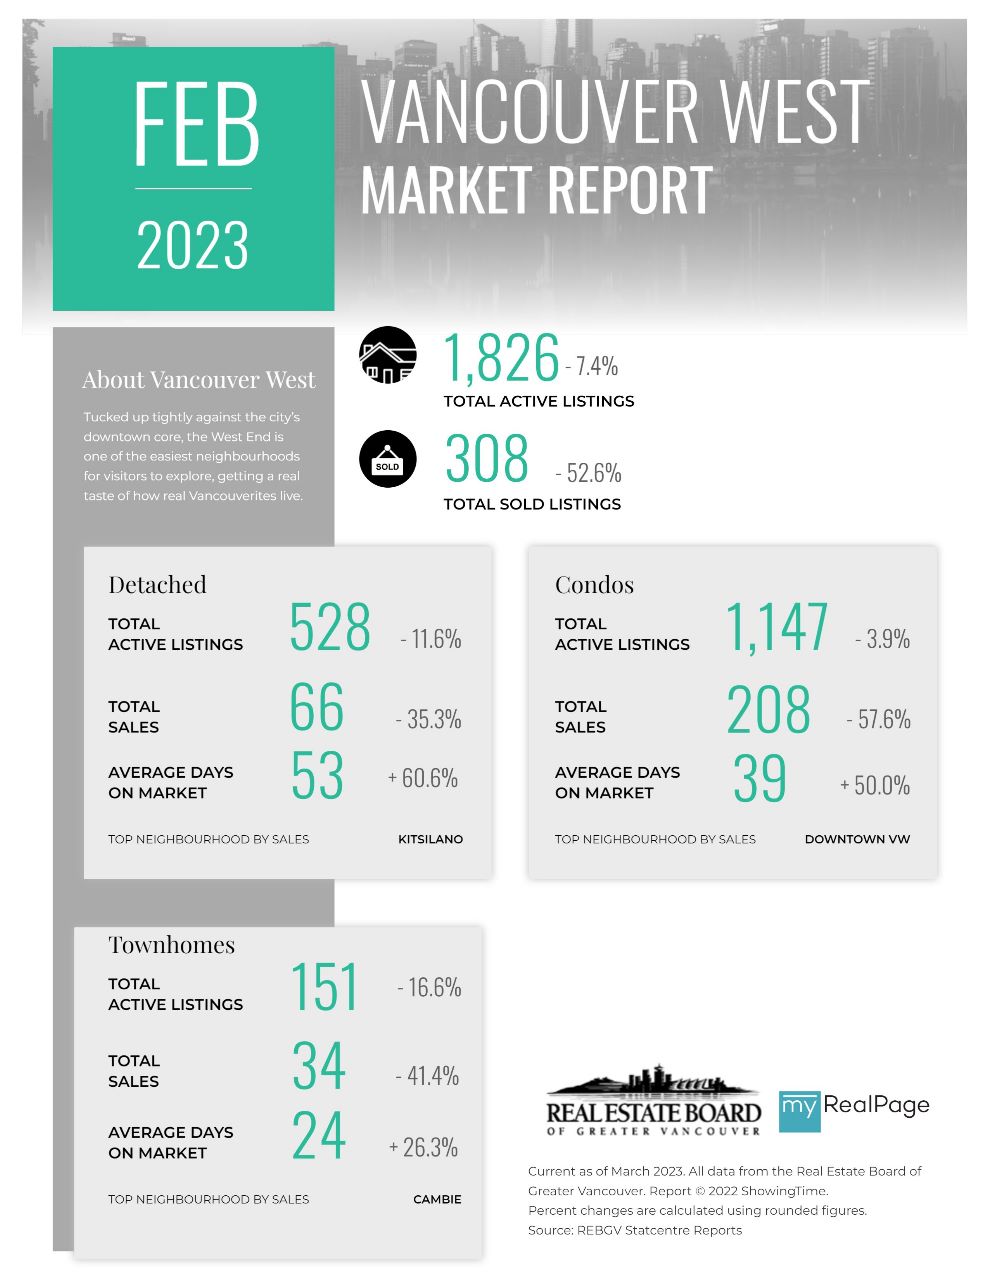
Printable Version – REBGV February 2023 Data Infographics Report Vancouver West
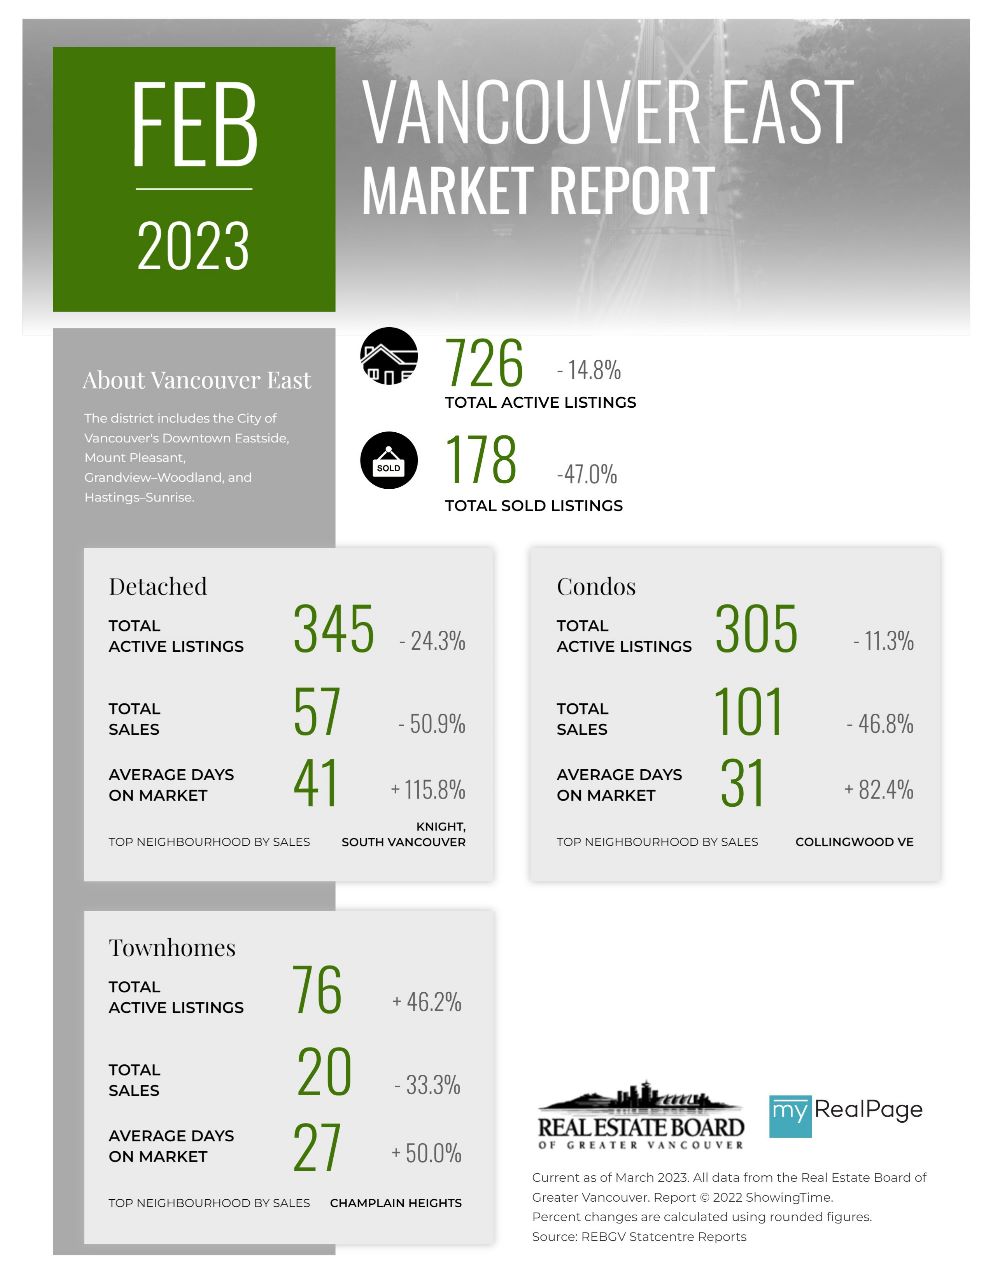
Printable Version – REBGV February 2023 Data Infographics Report Vancouver East
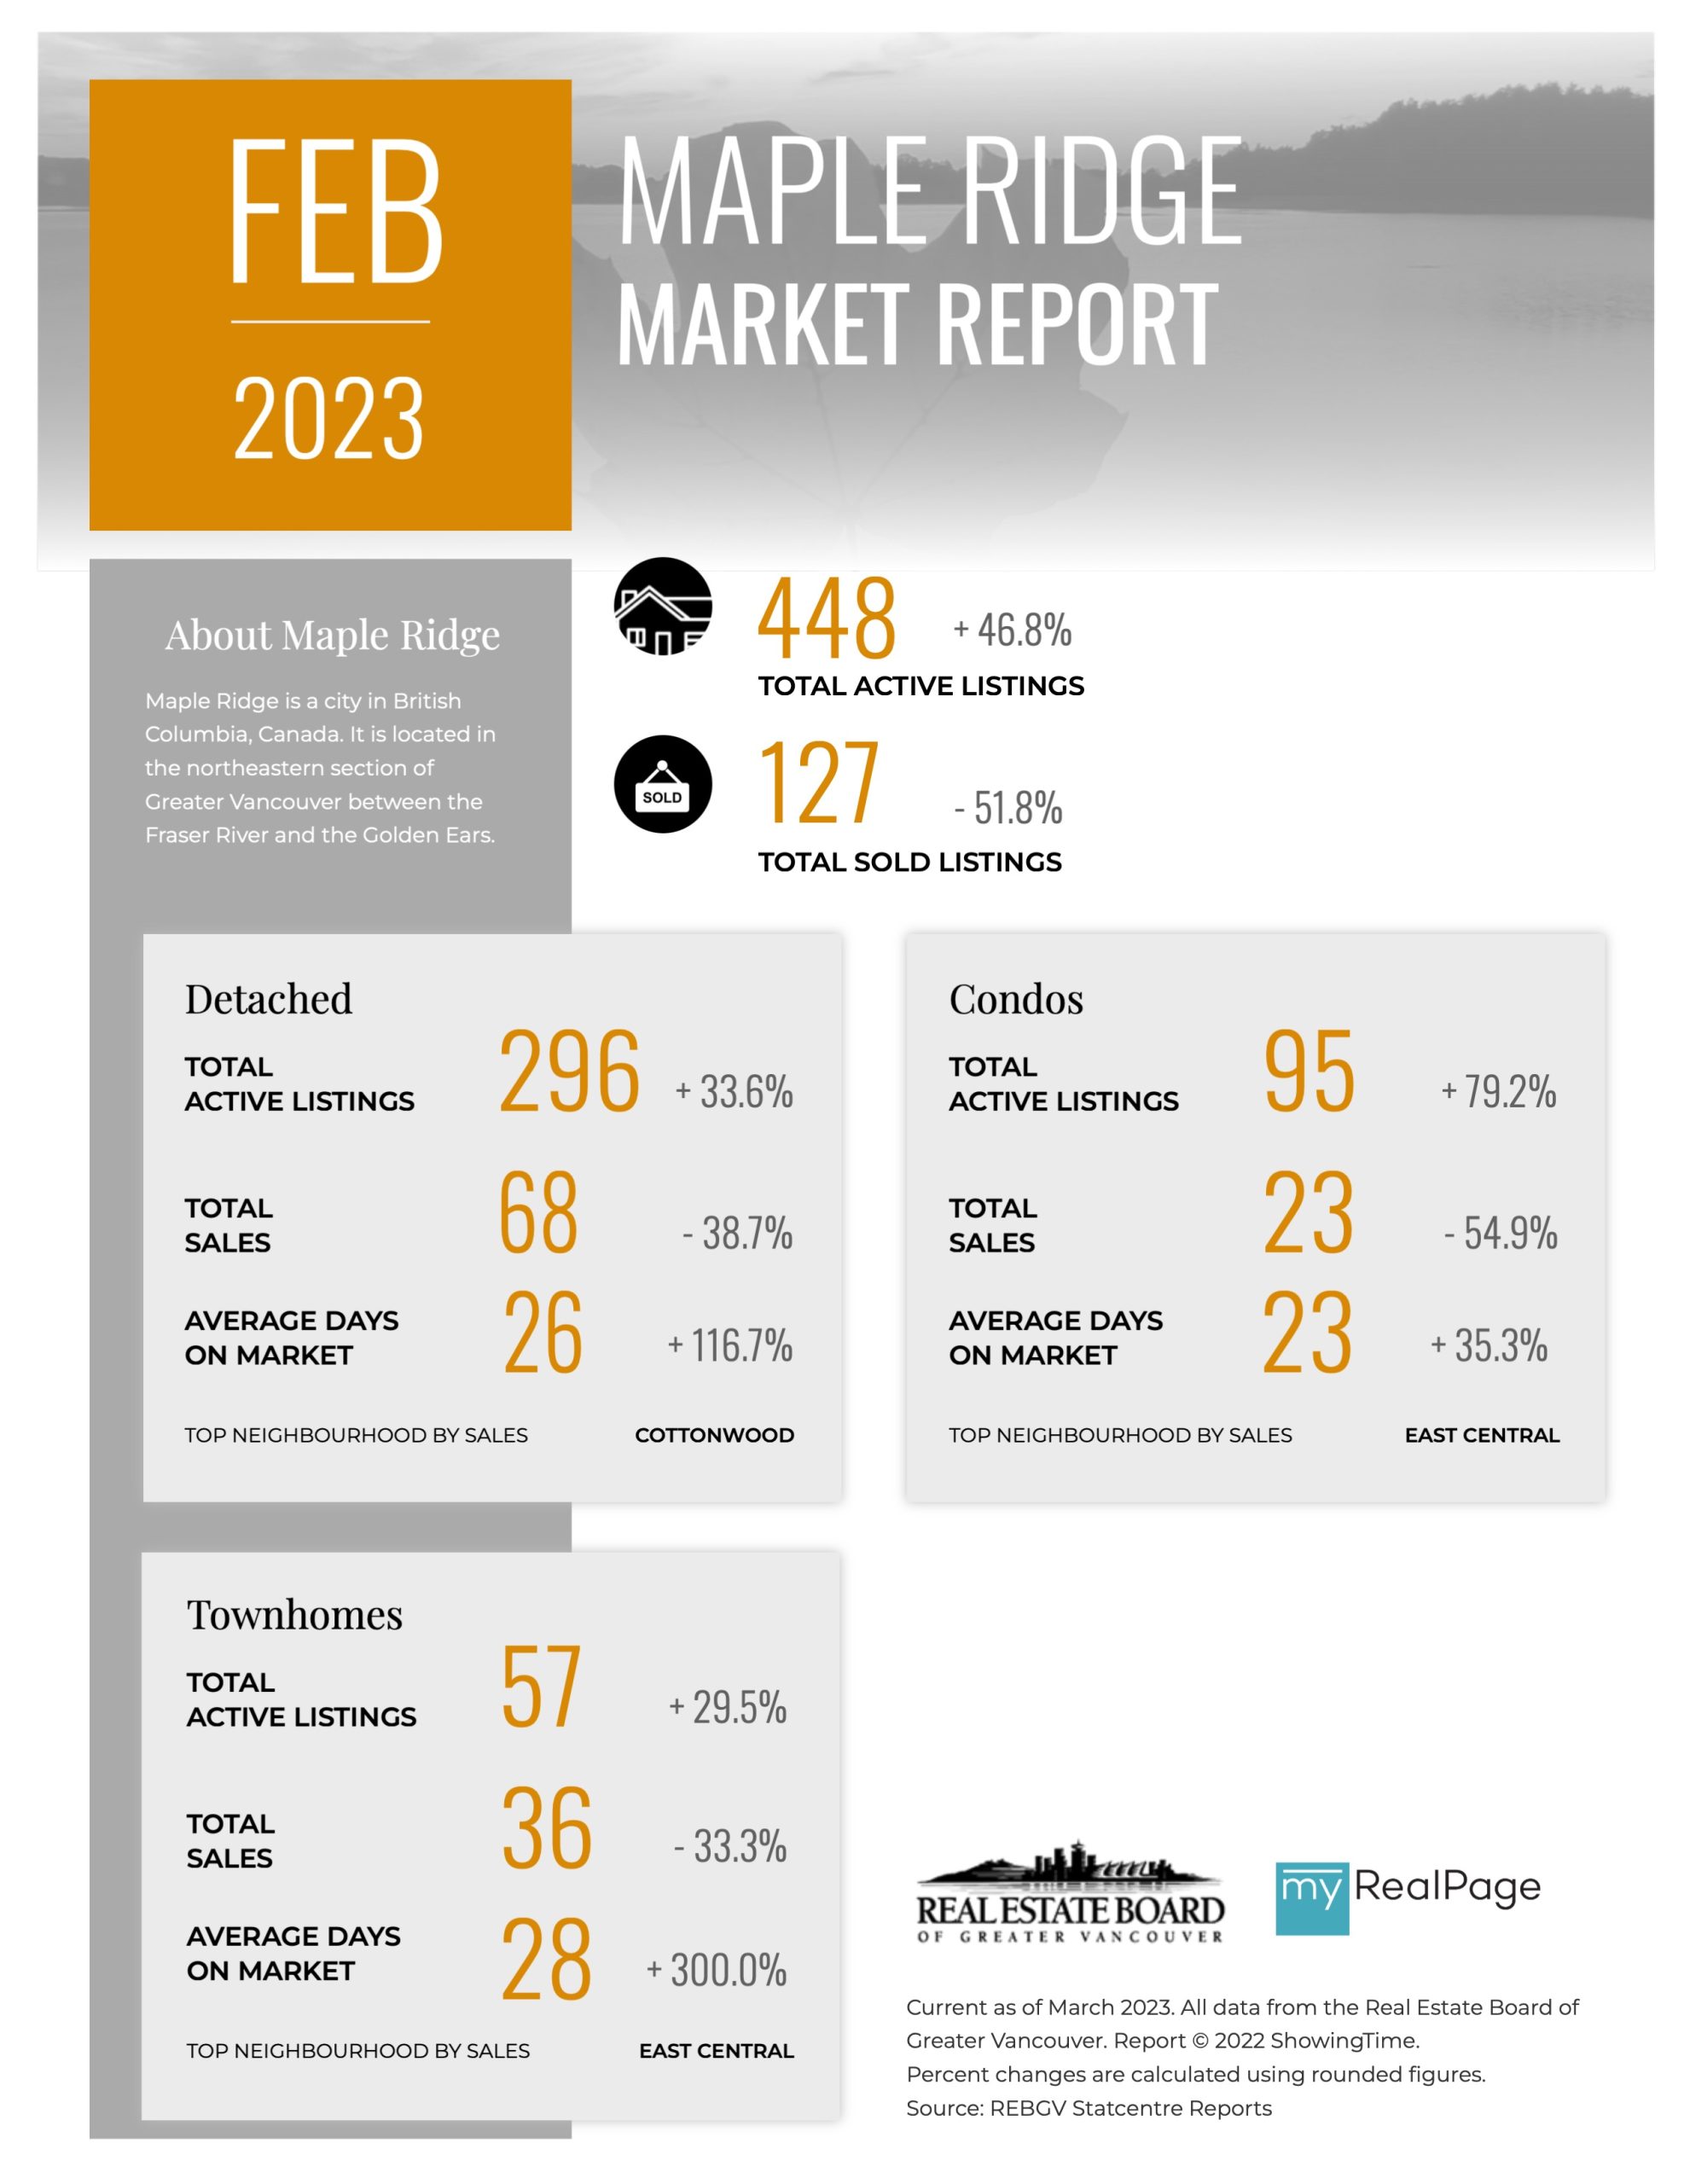
Printable Version – REBGV February 2023 Data Infographic Report Maple Ridge
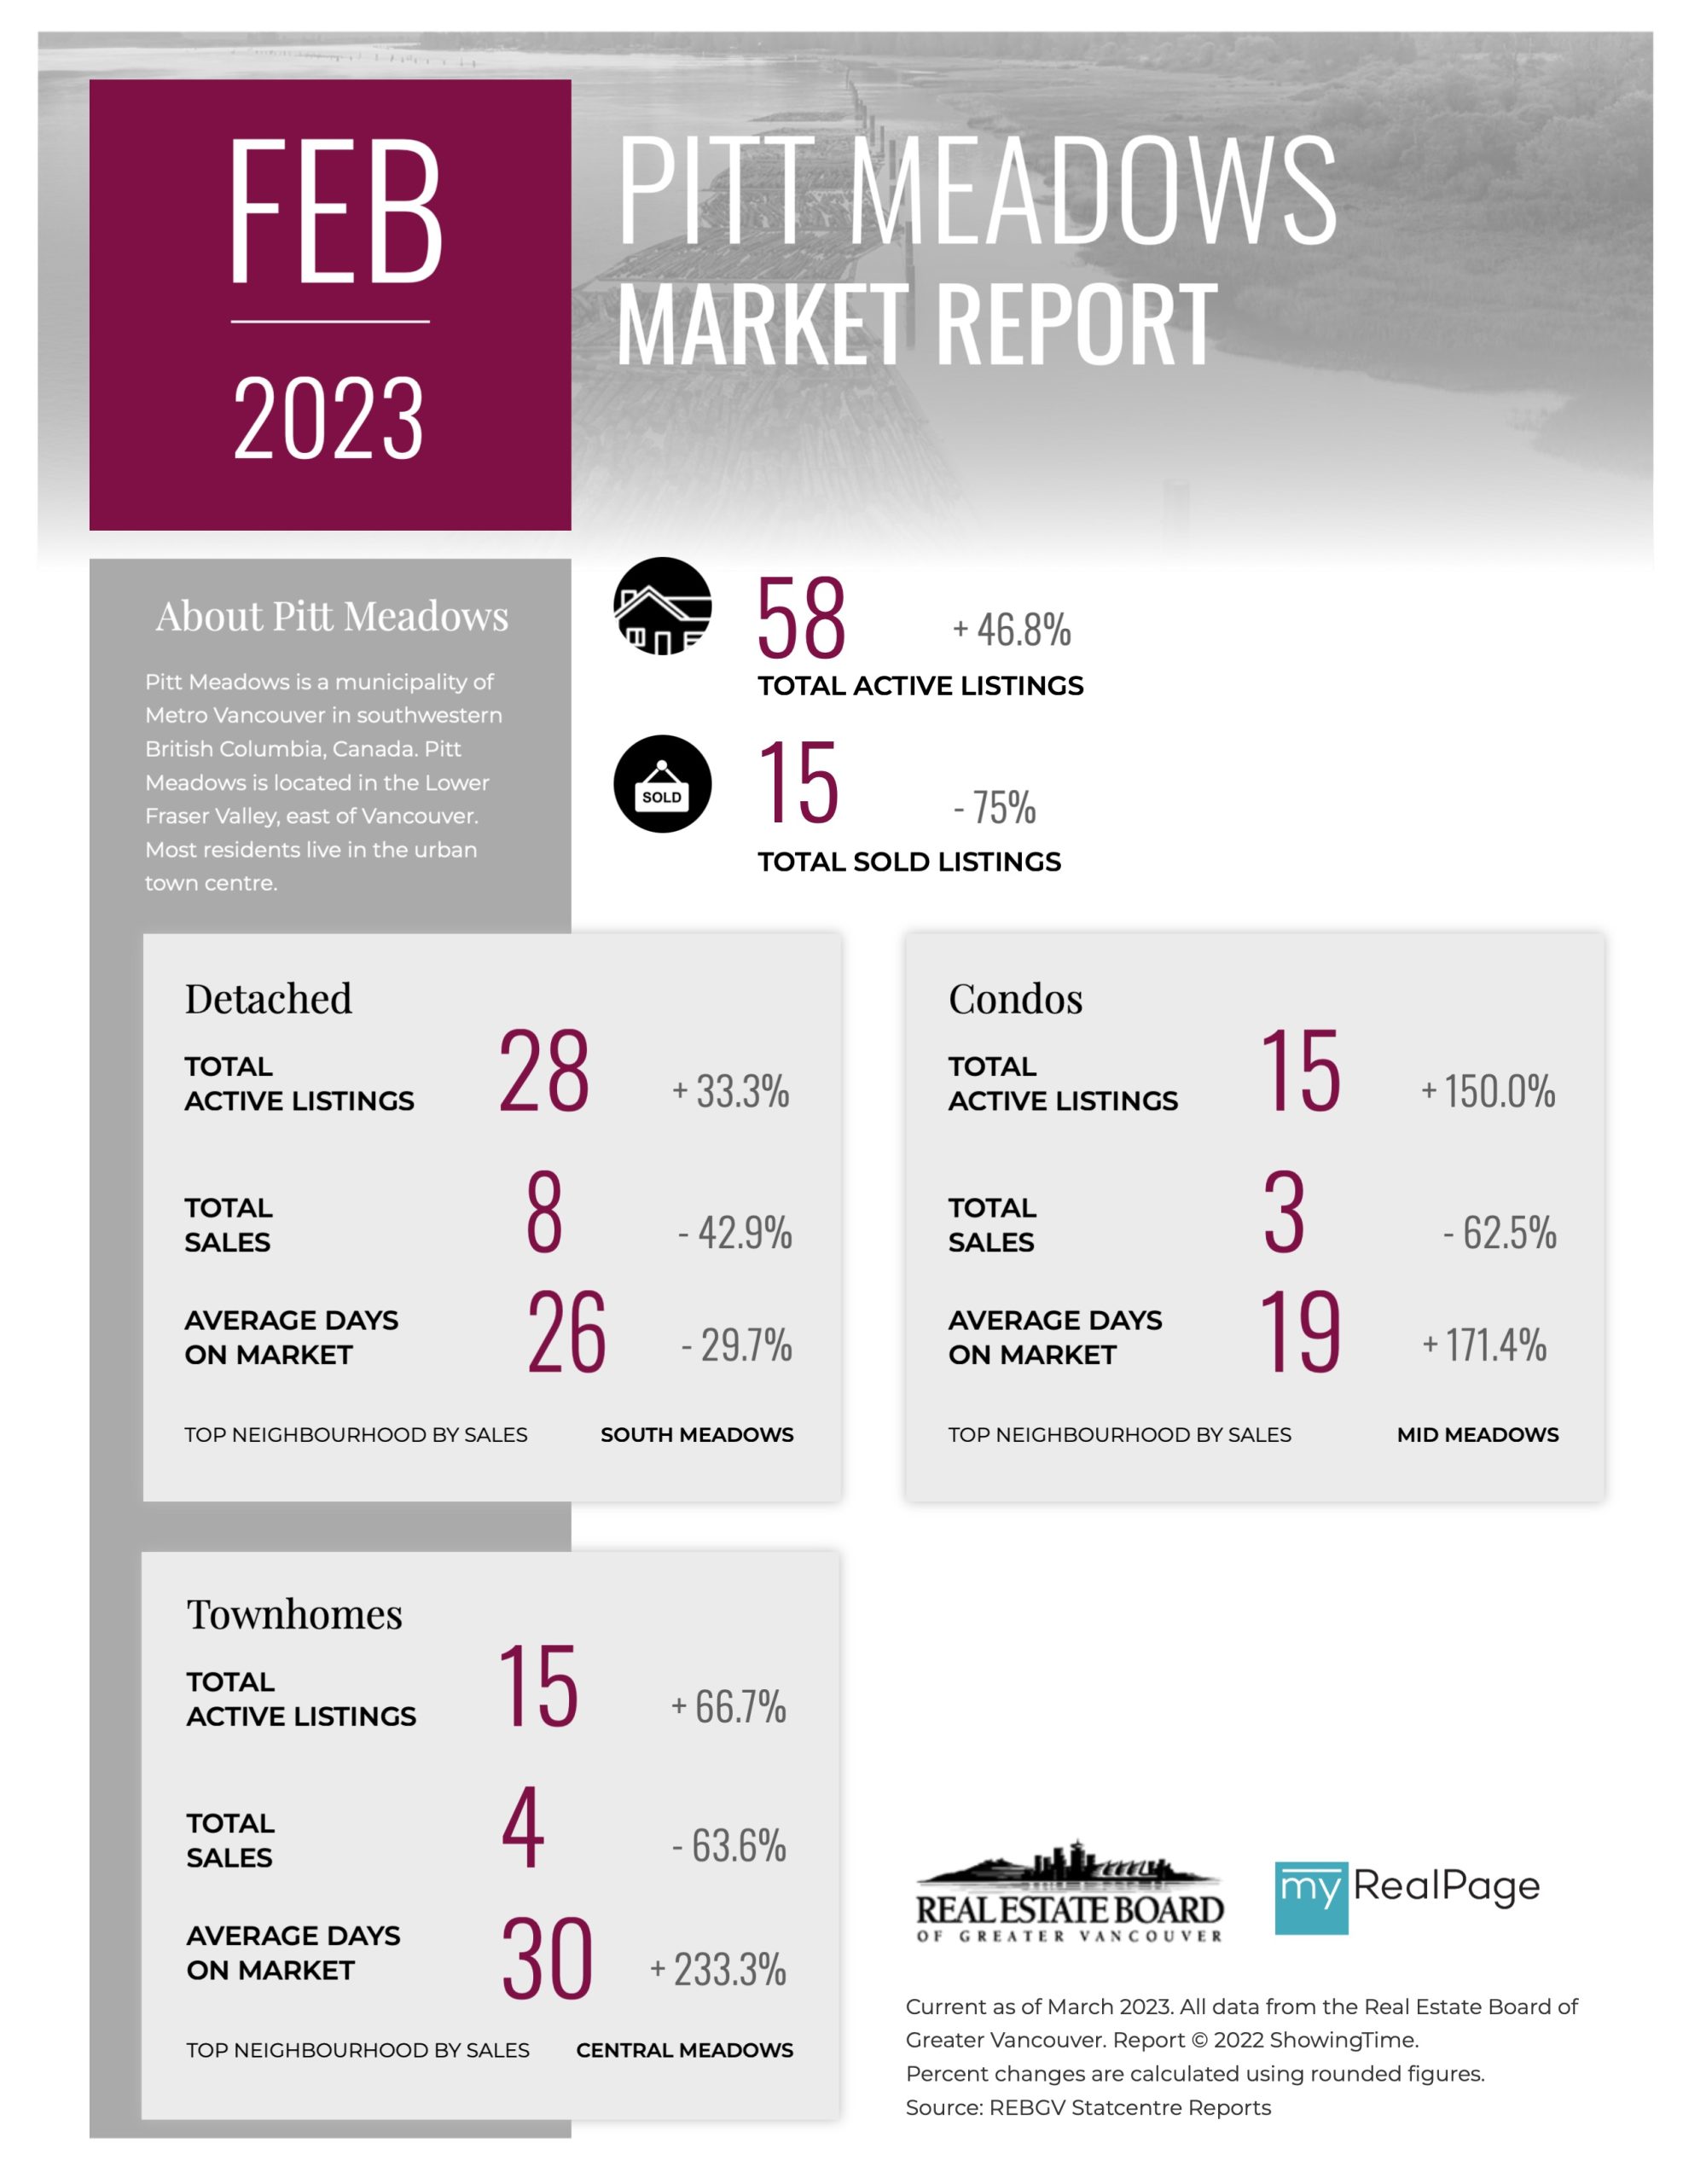
Printable Version – REBGV February 2023 Data Infographics Report Pitt Meadows
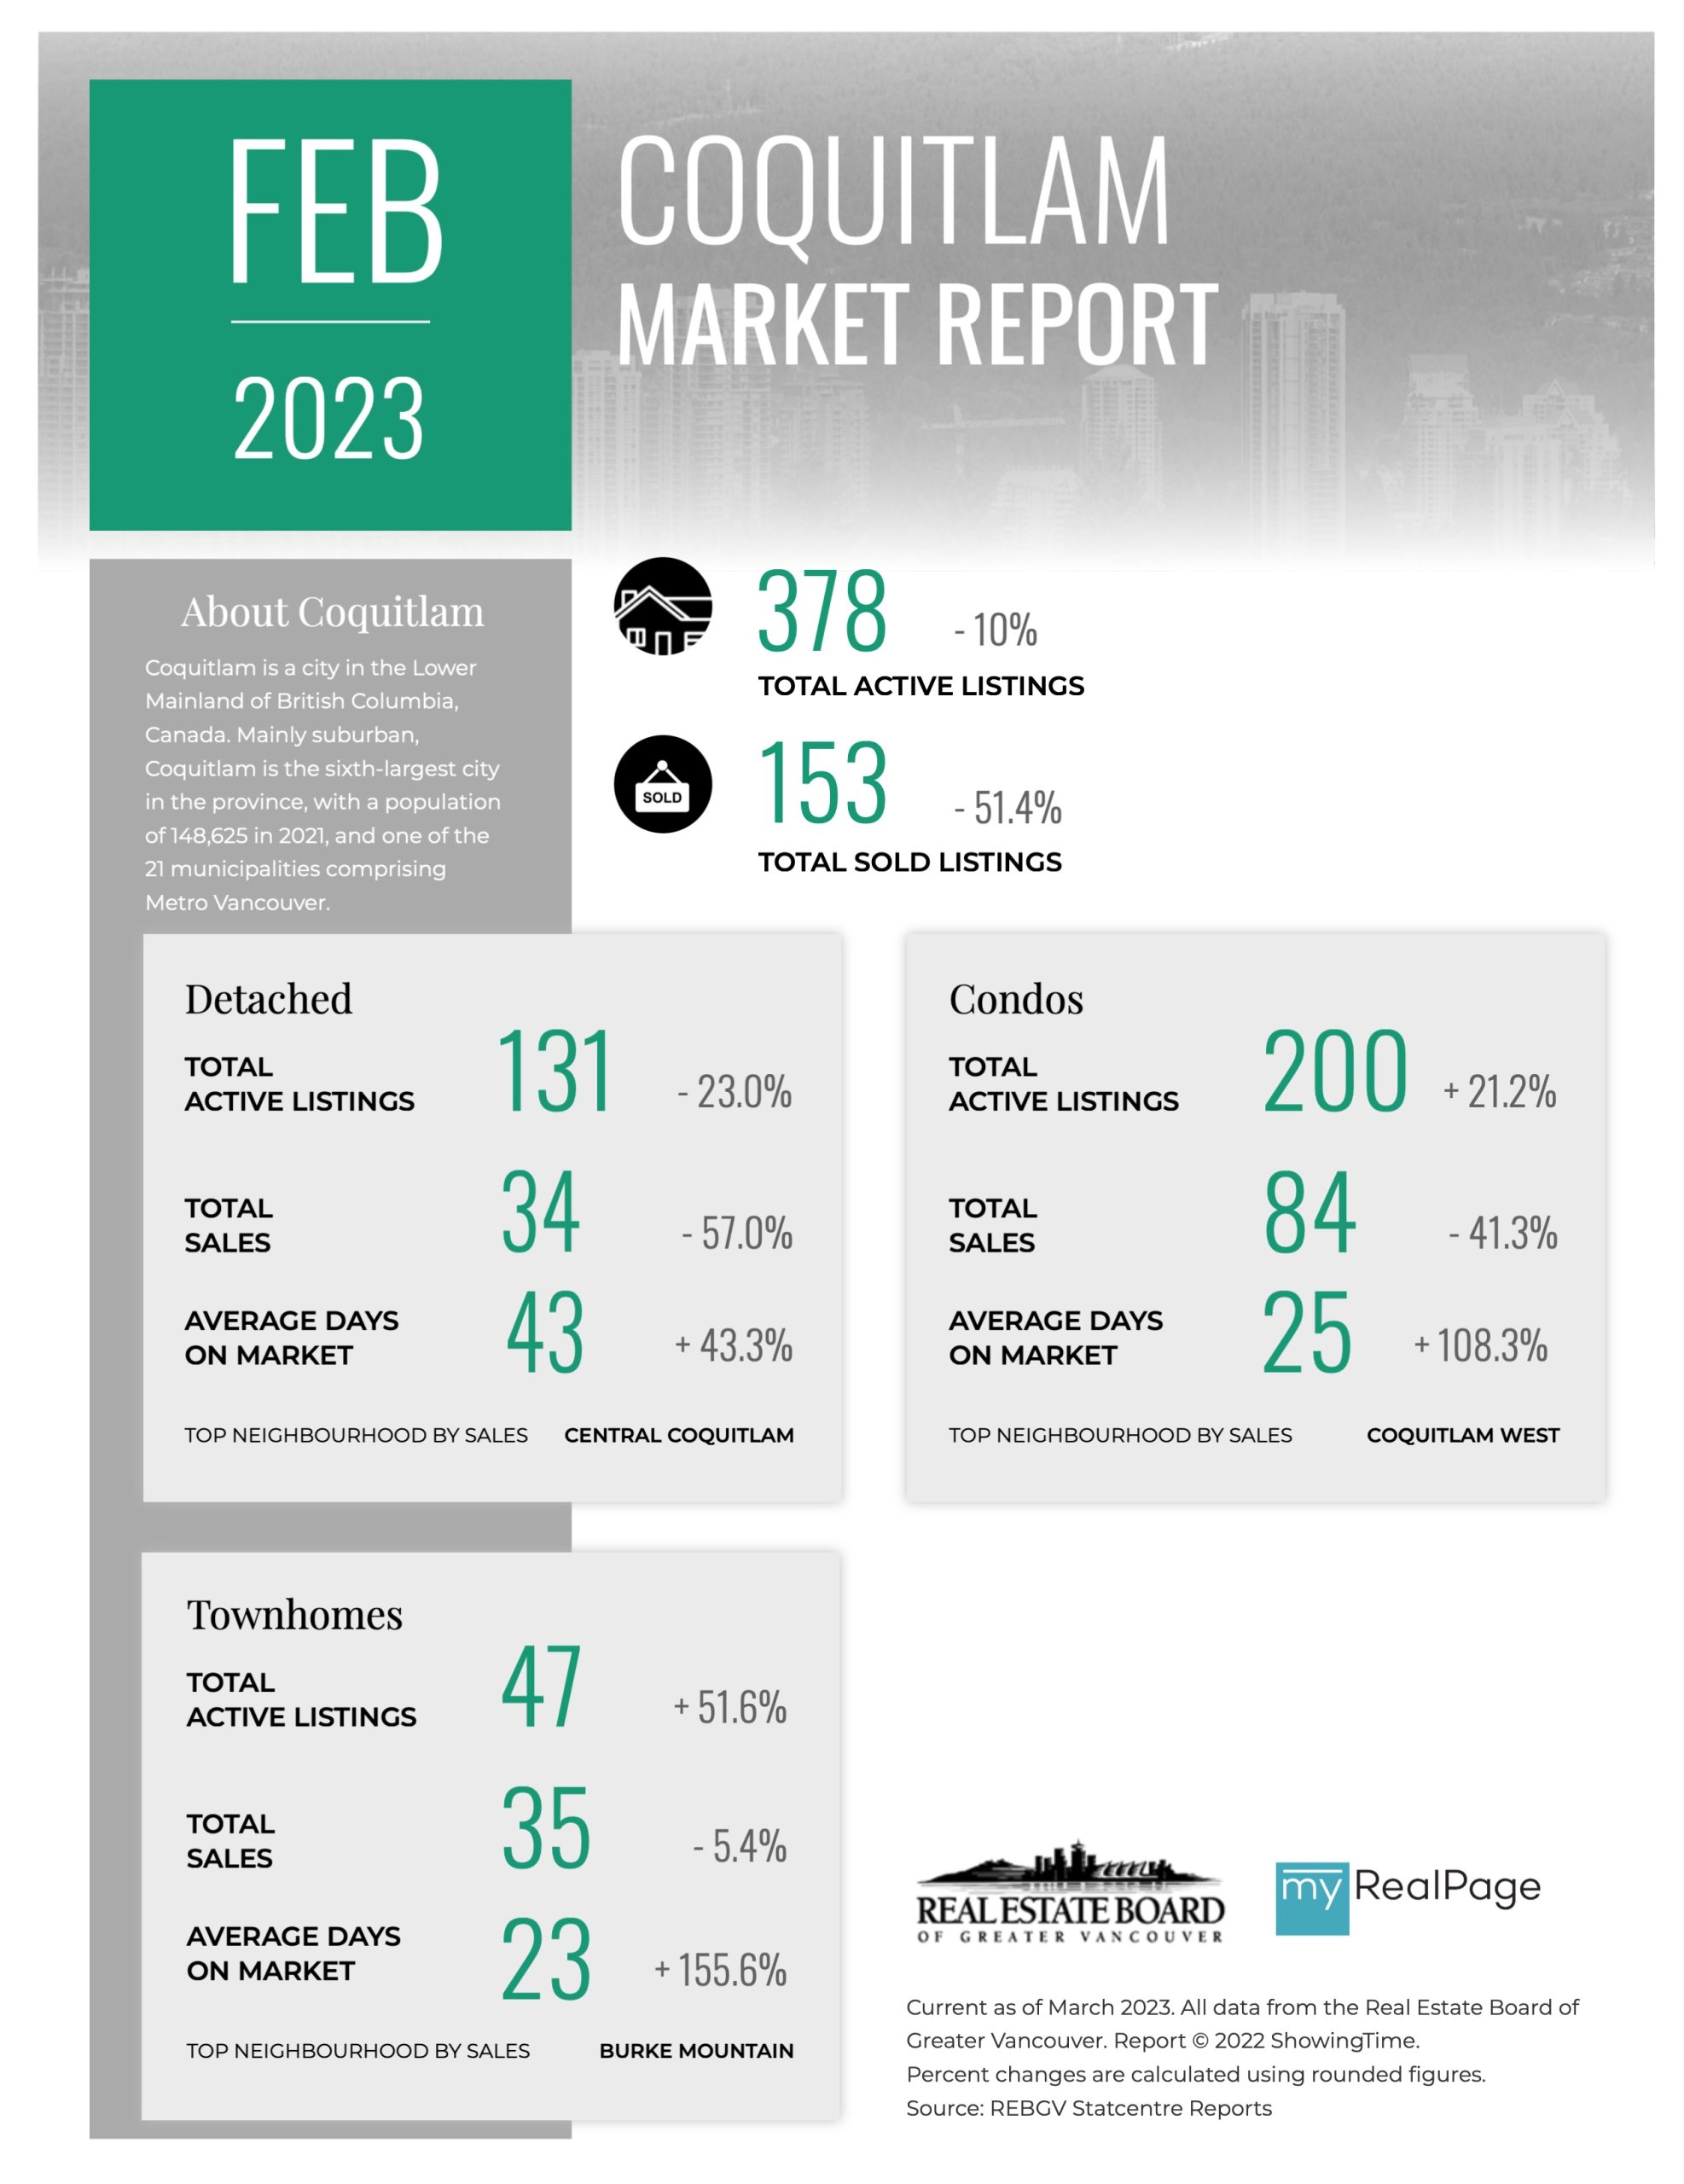
Printable Version – REBGV February 2023 Data Infographics Report Coquitlam
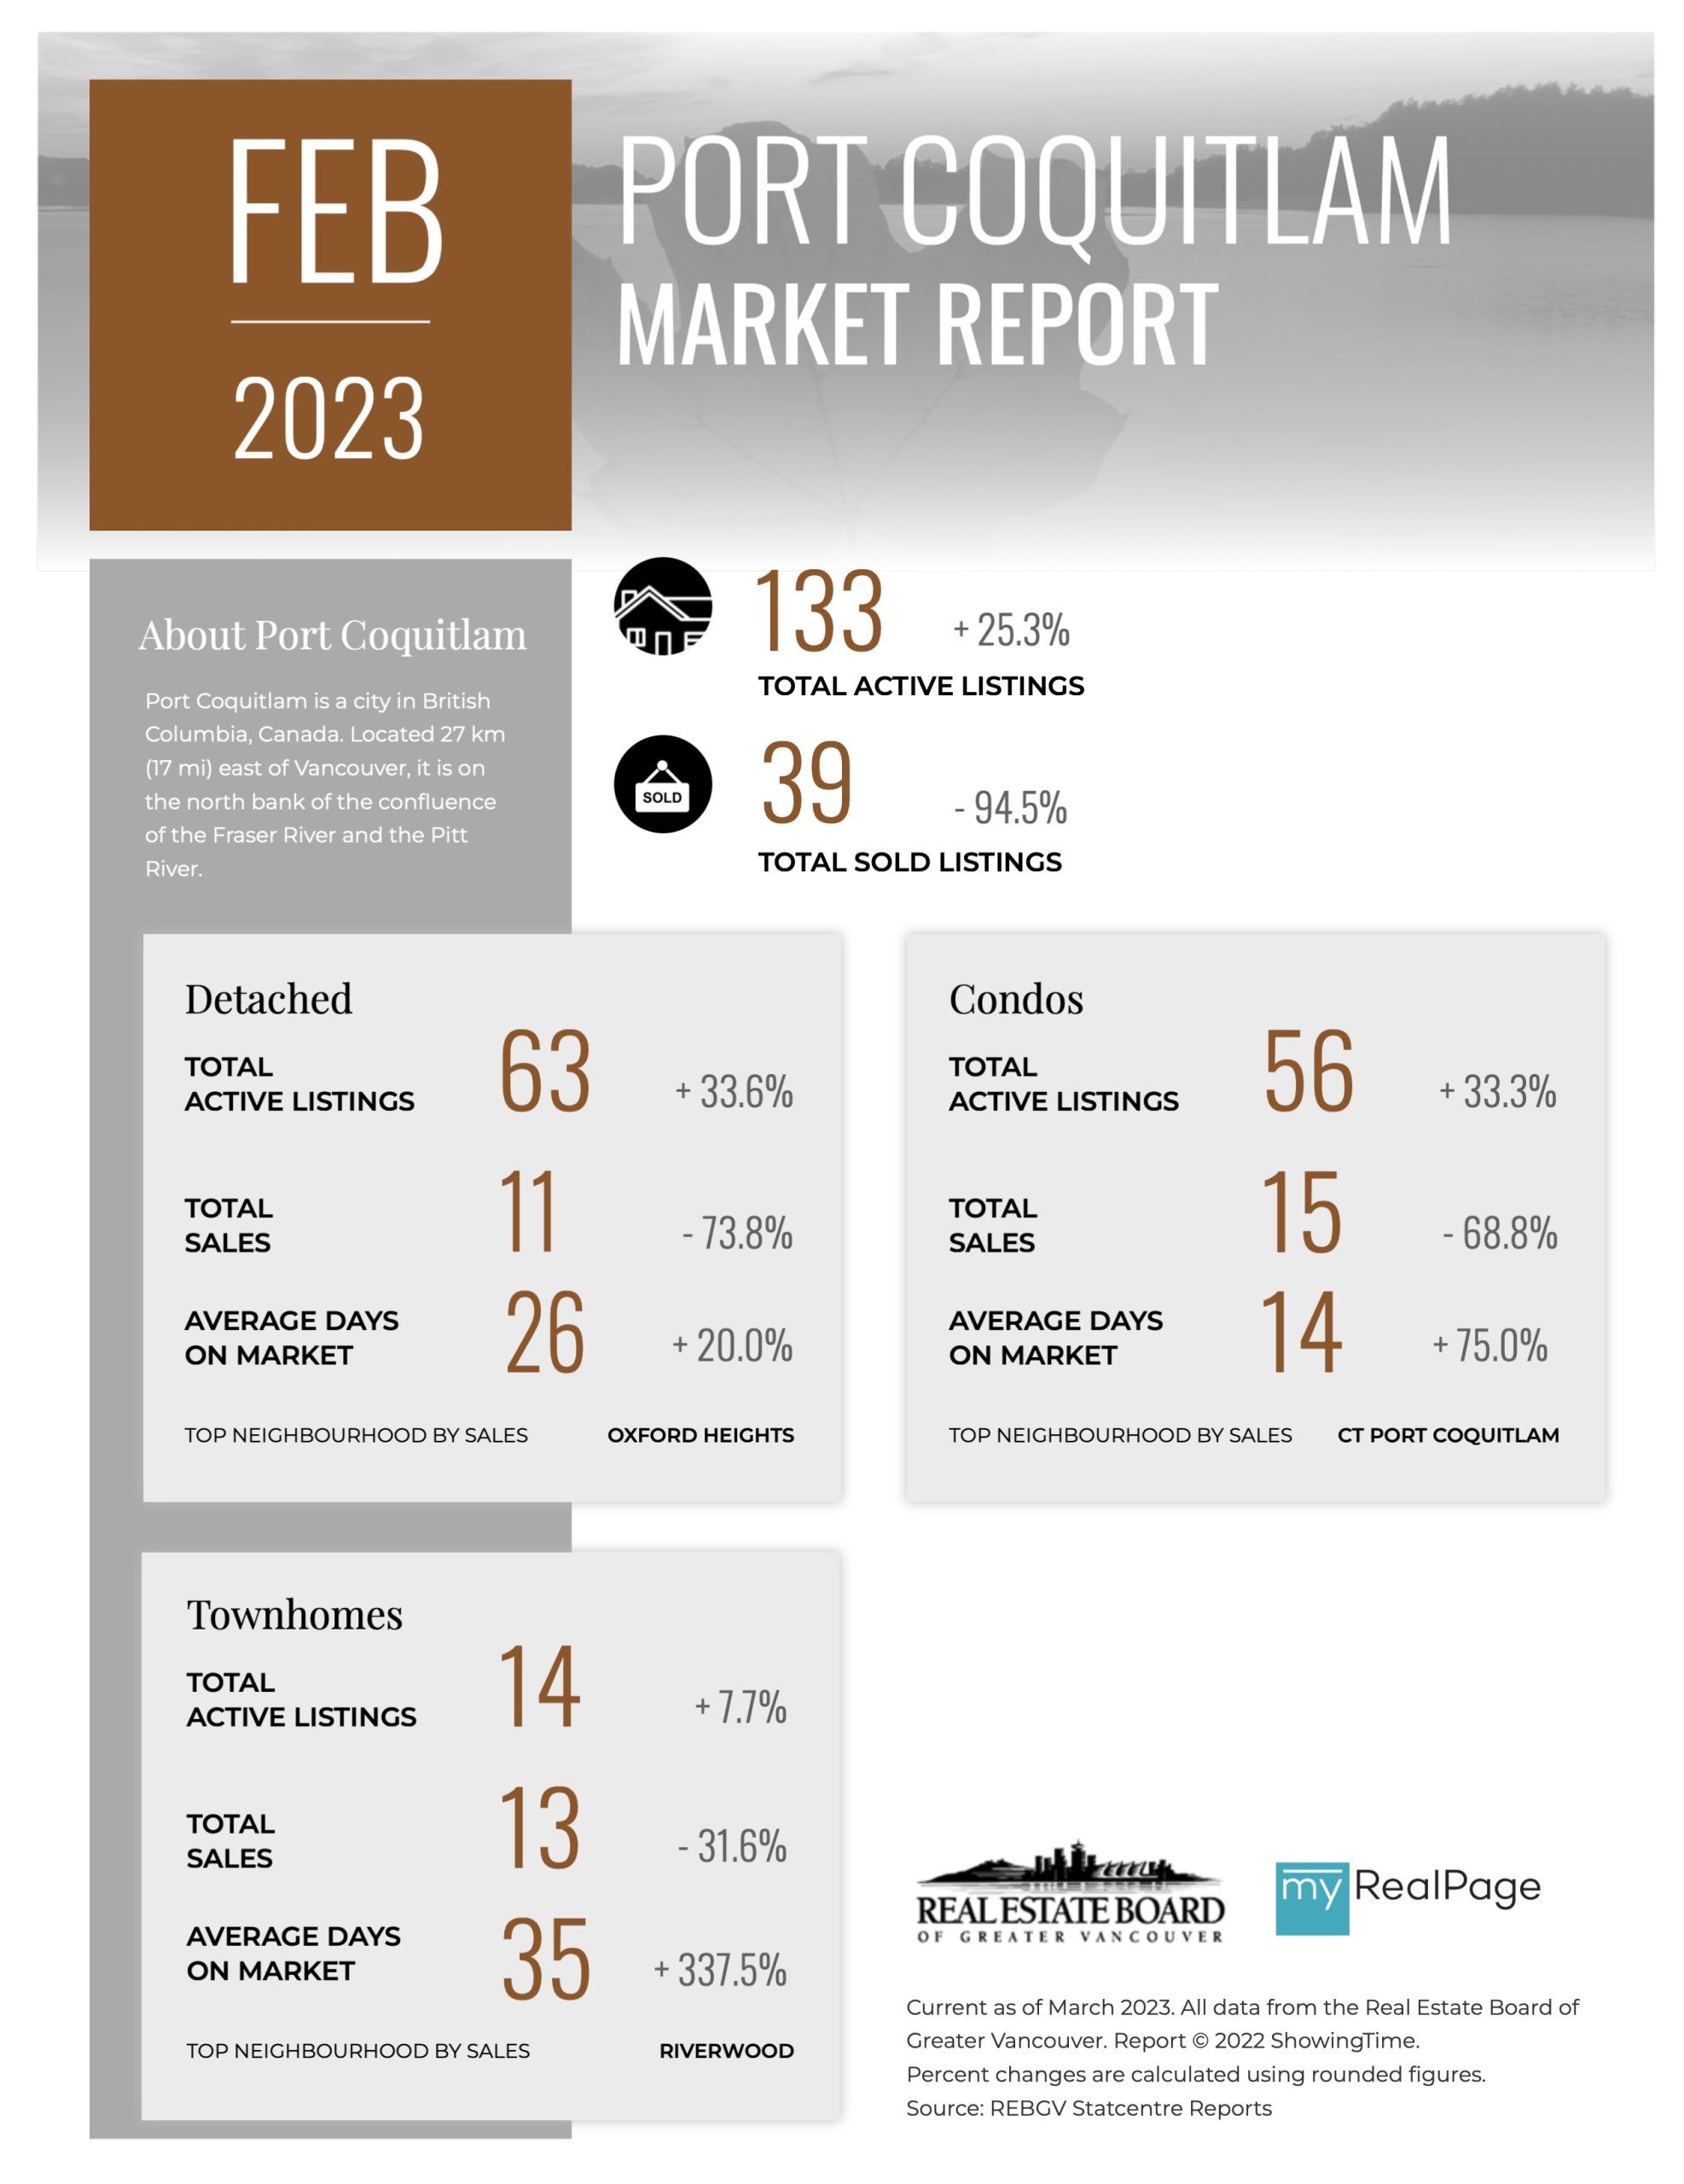
Printable Version – REBGV February 2023 Data Infographics Report Port Coquitlam


Last Updated on March 10, 2023 by myRealPage
