INFOGRAPHICS: January 2023 REBGV Greater Vancouver Market Reports

Home sales decline below long-term averages and inventory remains low
“Due to seasonality, market activity is quieter in January. With mortgage rates having risen so rapidly over the last year, we anticipated sales this month would be among the lowest in recent history. Looking forward, however, the Bank of Canada has said that it will pause further rate increases as long as the incoming economic data continues to support this policy stance. This should provide more certainty for home buyers and sellers in the market.”
Andrew Lis, REBGV Director, economics and data analytics
Inventory remains low in Metro Vancouver* while home sales dipped well below monthly historical averages in January.
The Real Estate Board of Greater Vancouver (REBGV) reports that residential home sales in the region totalled 1,022 in January 2023, a 55.3 per cent decrease from the 2,285 sales recorded in January 2022, and a 21.1 per cent decrease from the 1,295 homes sold in December 2022.
Last month’s sales were 42.9 per cent below the 10-year January sales average.
Read the full report on the REBGV website!
The following data is a comparison between January 2023 and January 2022 numbers, and is current as of February 2023. For last month’s update, you can check out our previous post!
Or follow this link for all our REBGV Infographics!
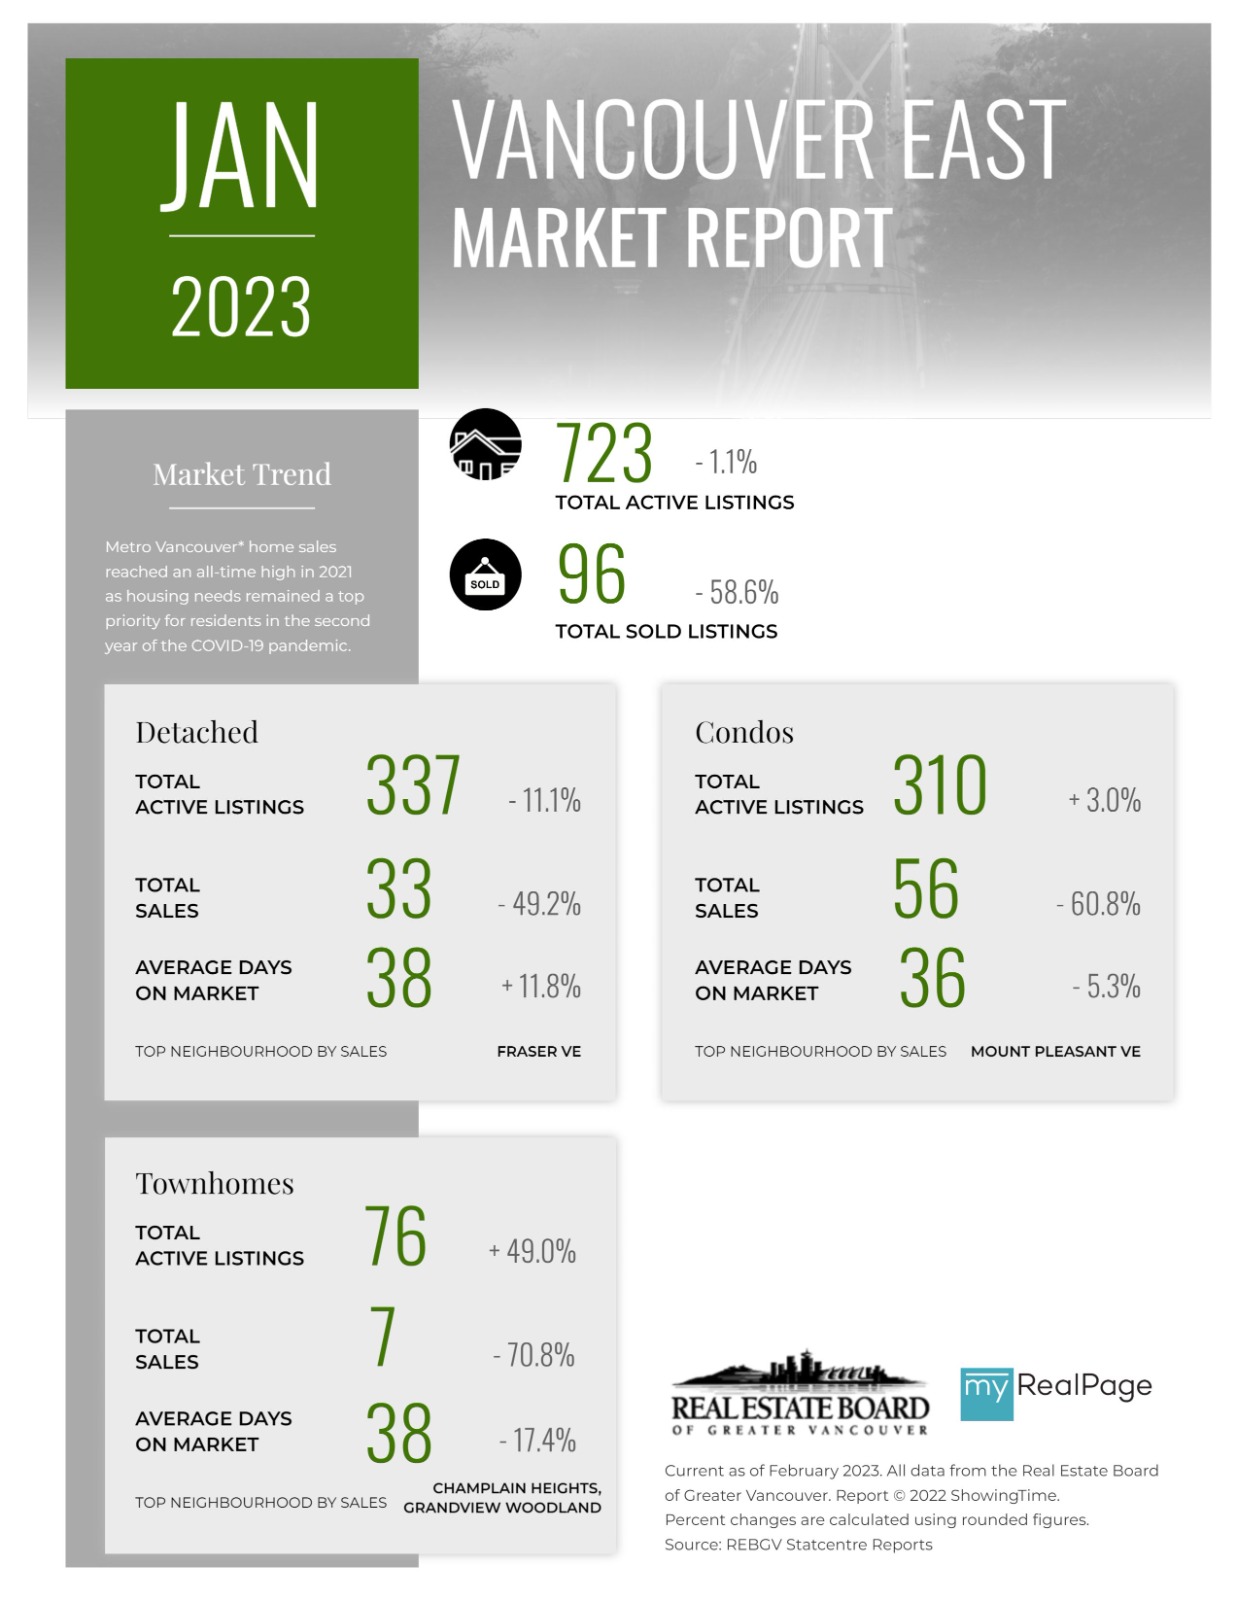
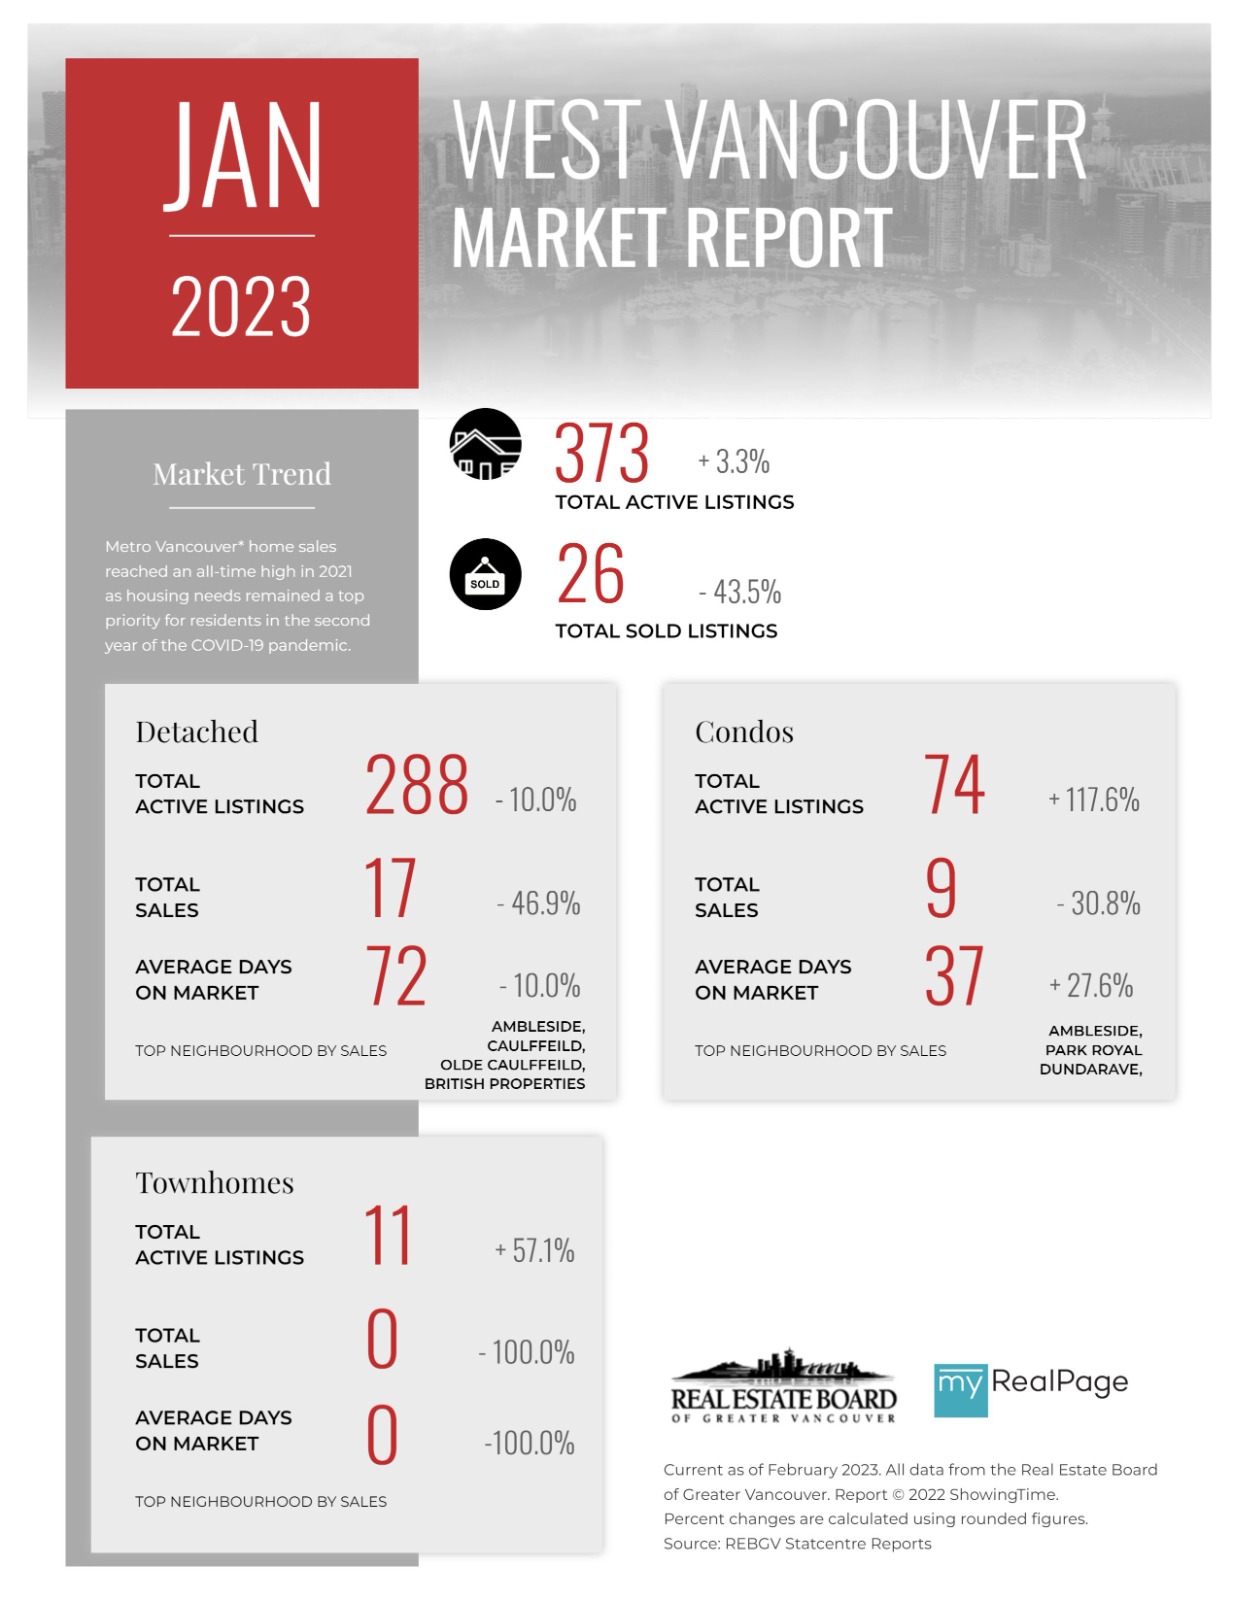
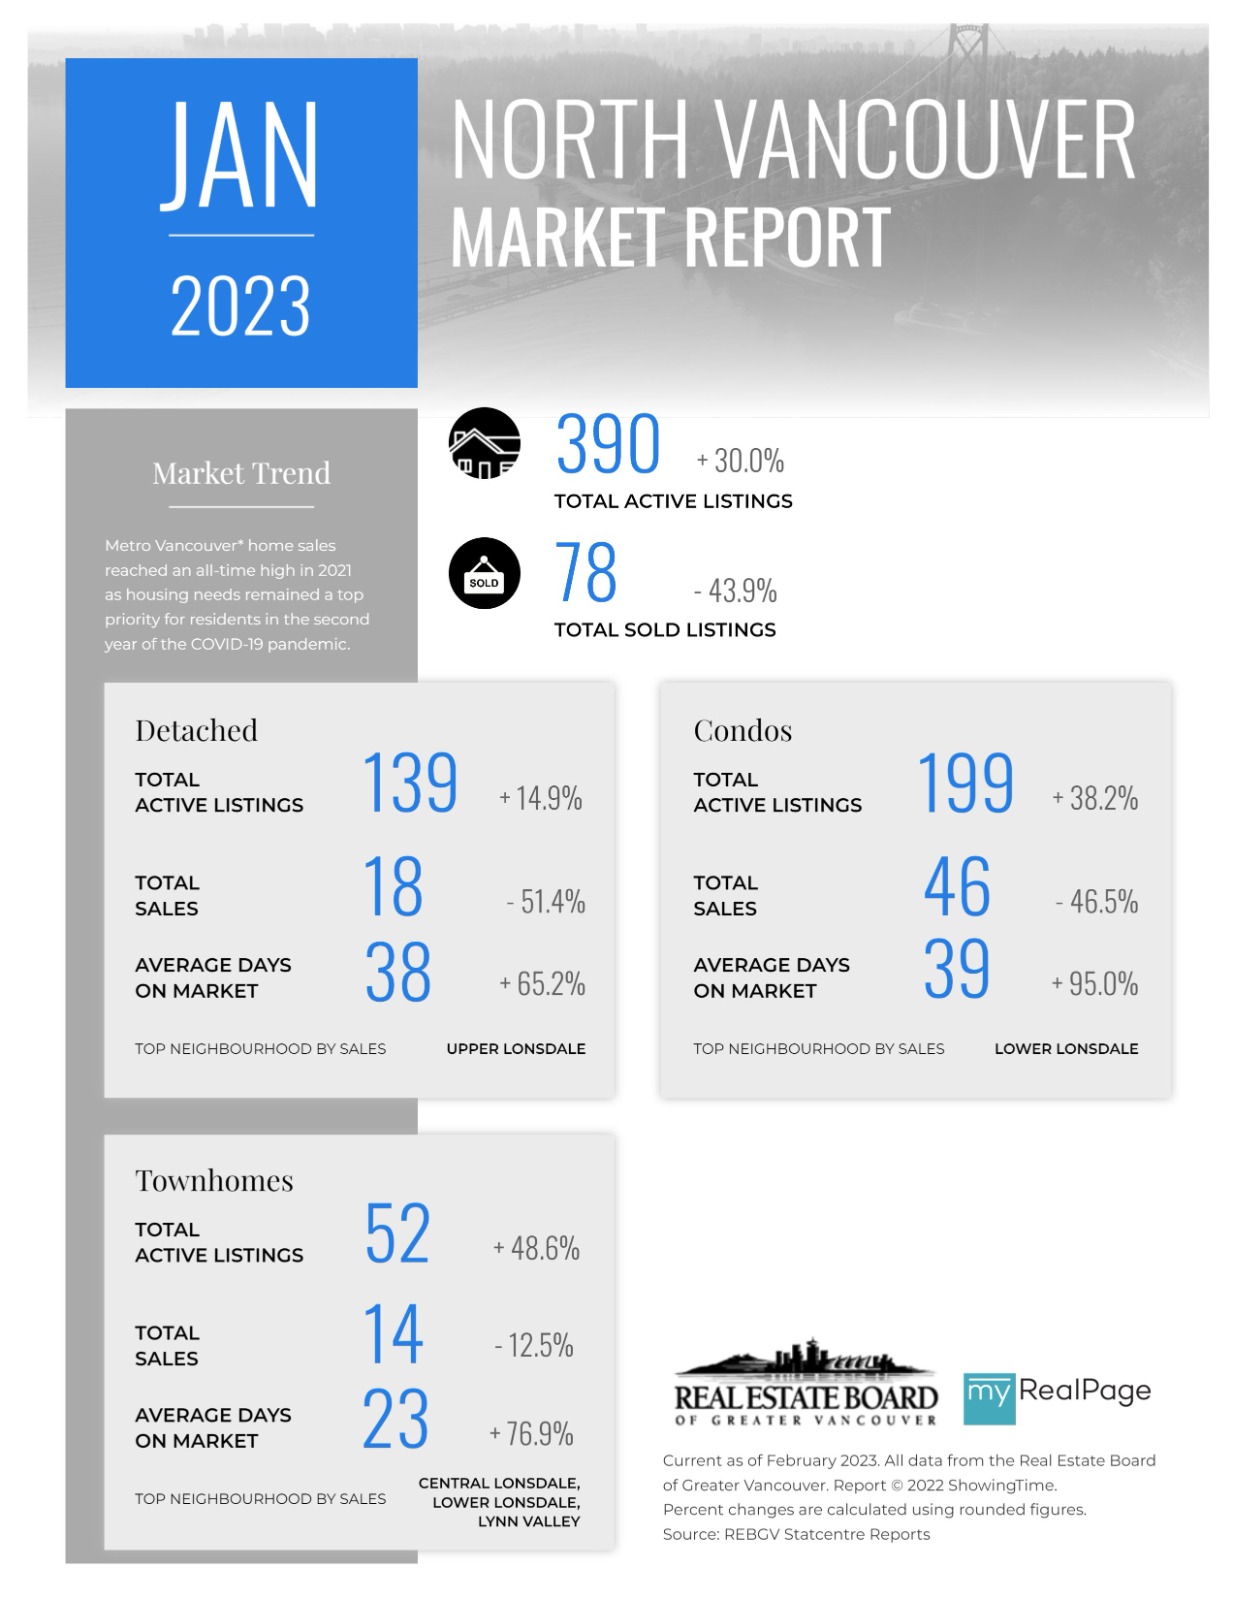
These infographics cover current trends in North Vancouver, West Vancouver, Vancouver East, and Vancouver West. Click on the images for a larger view!
Download Printable Version – REBGV January 2023 Data Infographic Report North Vancouver
Download Printable Version – REBGV January 2023 Data Infographics Report West Vancouver
Download Printable Version – REBGV January 2023 Data Infographics Report Vancouver West
Download Printable Version – REBGV January 2023 Data Infographics Report Vancouver East

Last Updated on February 7, 2023 by myRealPage
