INFOGRAPHICS: December 2022 REBGV Greater Vancouver Market Reports

Rising mortgage rates brought uncertainty and caution in 2022
After seeing record sales and prices during the pandemic, Metro Vancouver’s* housing market experienced a year of caution in 2022 due to rising borrowing costs fueled by the Bank of Canada’s ongoing battle with inflation.
The Real Estate Board of Greater Vancouver (REBGV) reports that residential home sales in the region totalled 28,903 in 2022, a 34.3 per cent decrease from the 43,999 sales recorded in 2021, and a 6.6 per cent decrease from the 30,944 homes sold in 2020.
Last year’s sales total was 13.4 per cent below the 10-year sales average.
Andrew Lis, REBGV Director, economics and data analytics
Read the full report on the REBGV website!
The following data is a comparison between December 2022 and December 2021 numbers, and is current as of January 2023. For last month’s update, you can check out our previous post!
Or follow this link for all our REBGV Infographics!
These infographics cover current trends in North Vancouver, West Vancouver, Vancouver East, and Vancouver West. Click on the images for a larger view!
Download Printable Version – REBGV December 2022 Data Infographic Report North Vancouver
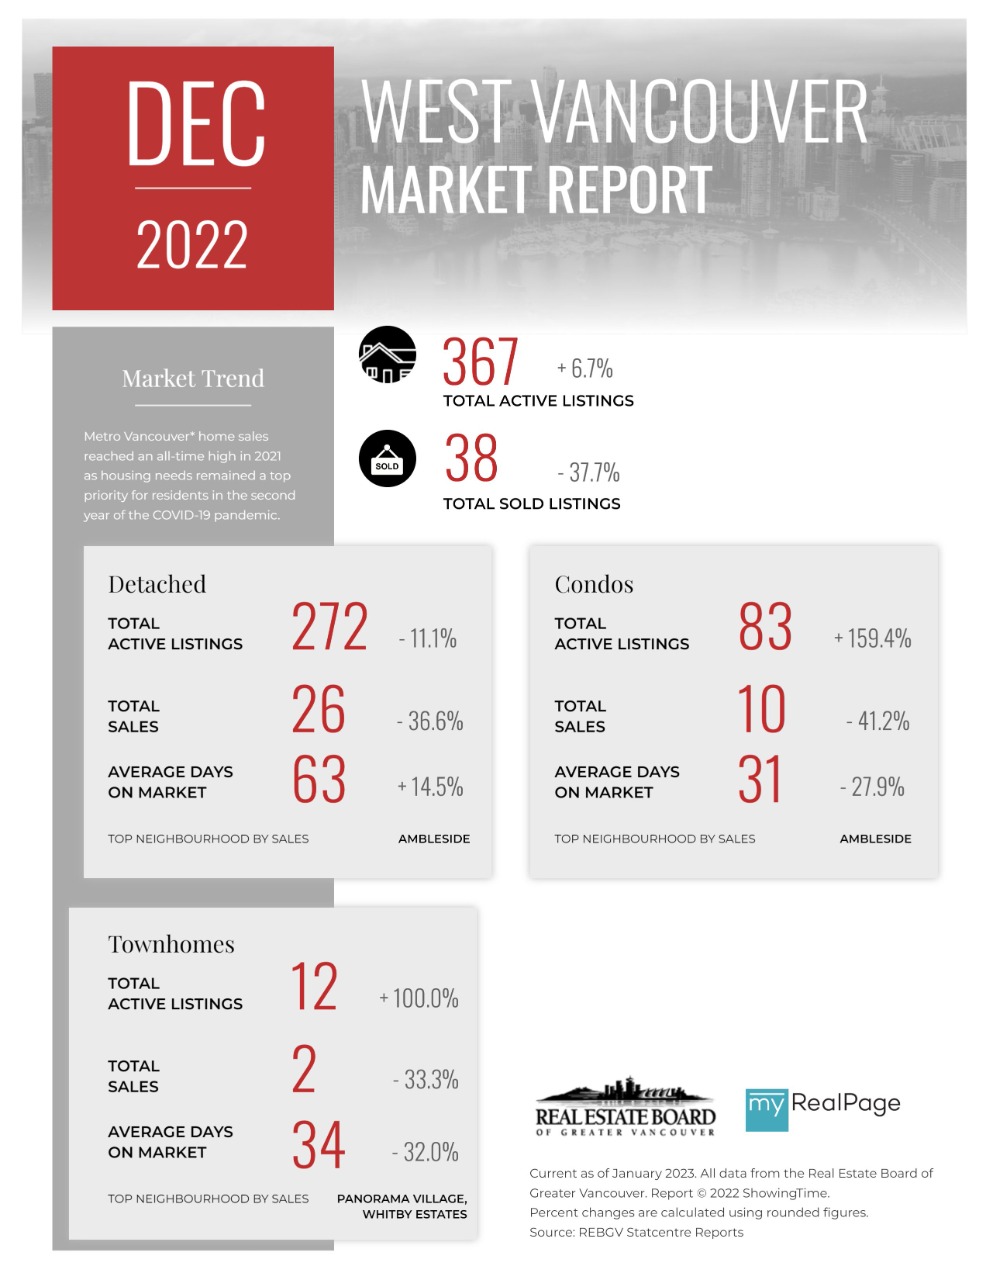
Download Printable Version – REBGV December 2022 Data Infographics Report West Vancouver
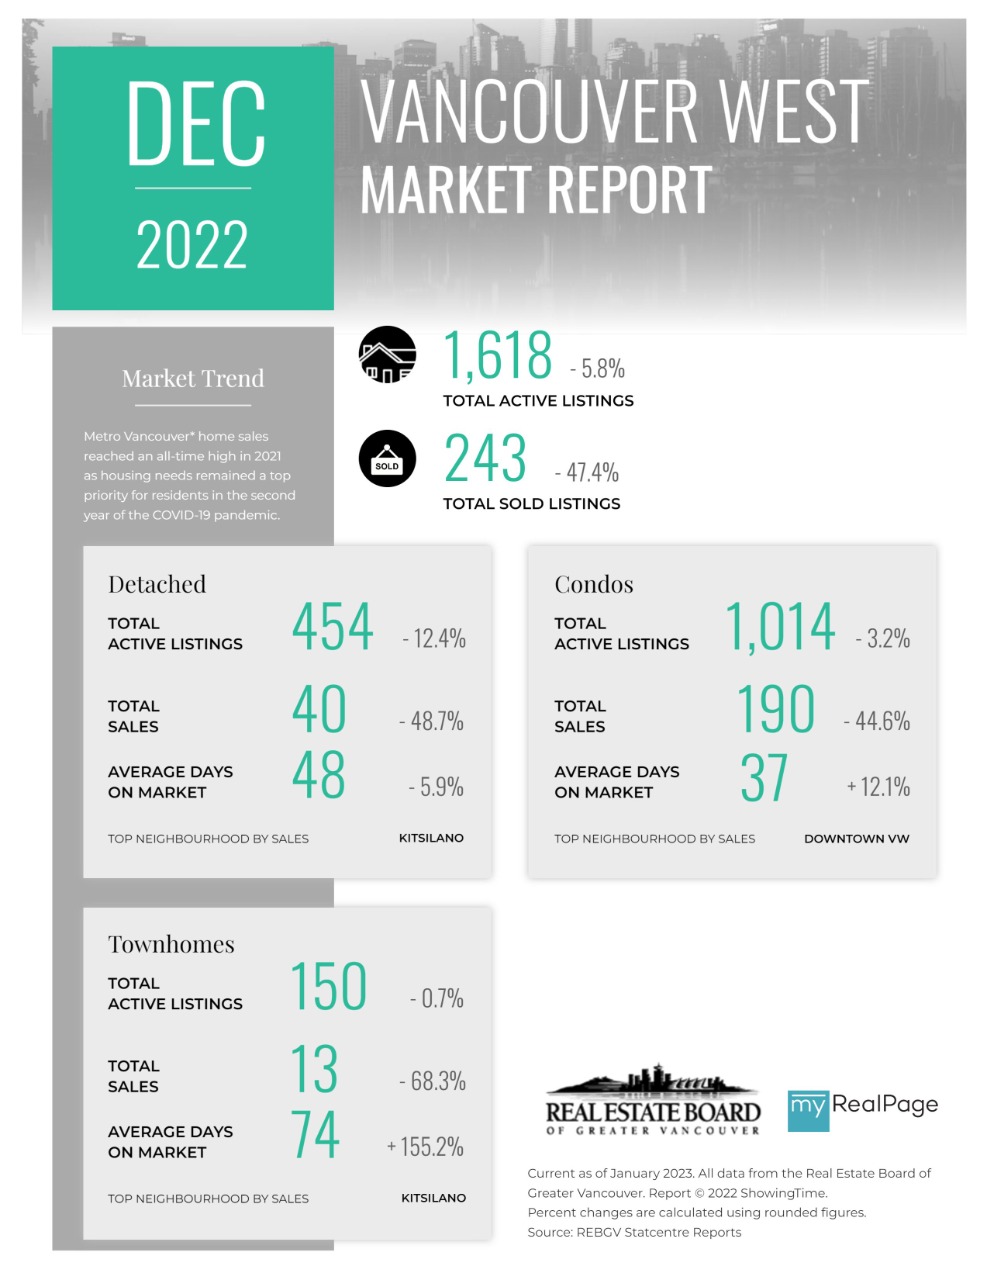
Download Printable Version – REBGV December 2022 Data Infographics Report Vancouver West
Download Printable Version – REBGV December 2022 Data Infographics Report Vancouver East


Last Updated on January 9, 2023 by myRealPage
