INFOGRAPHICS: May 2019 CREB City And Region Market Reports

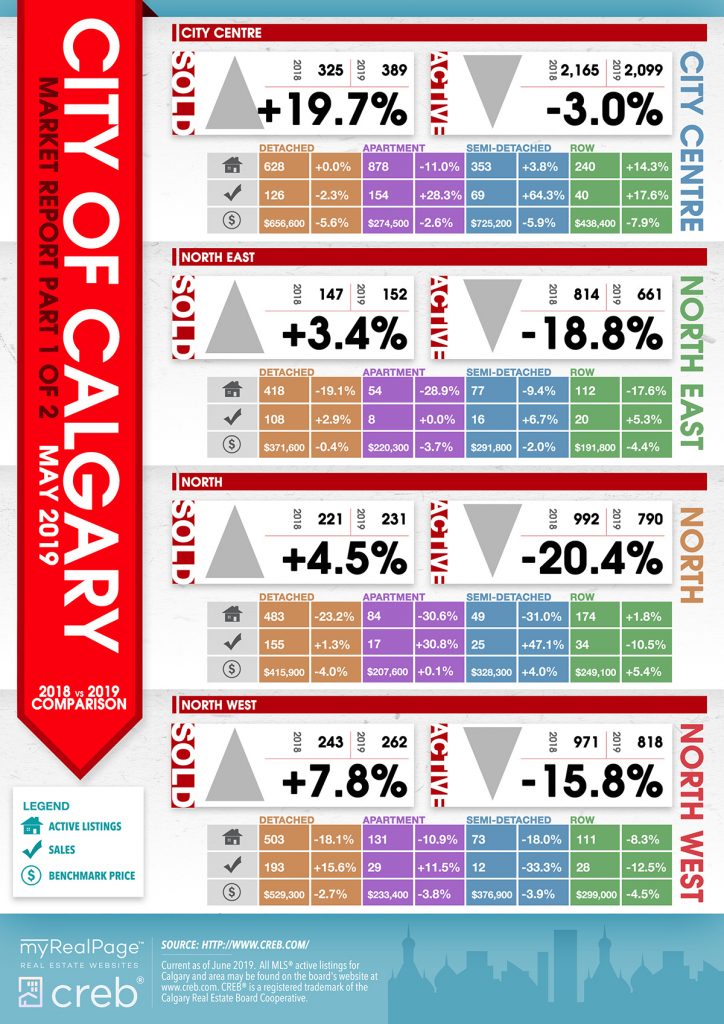
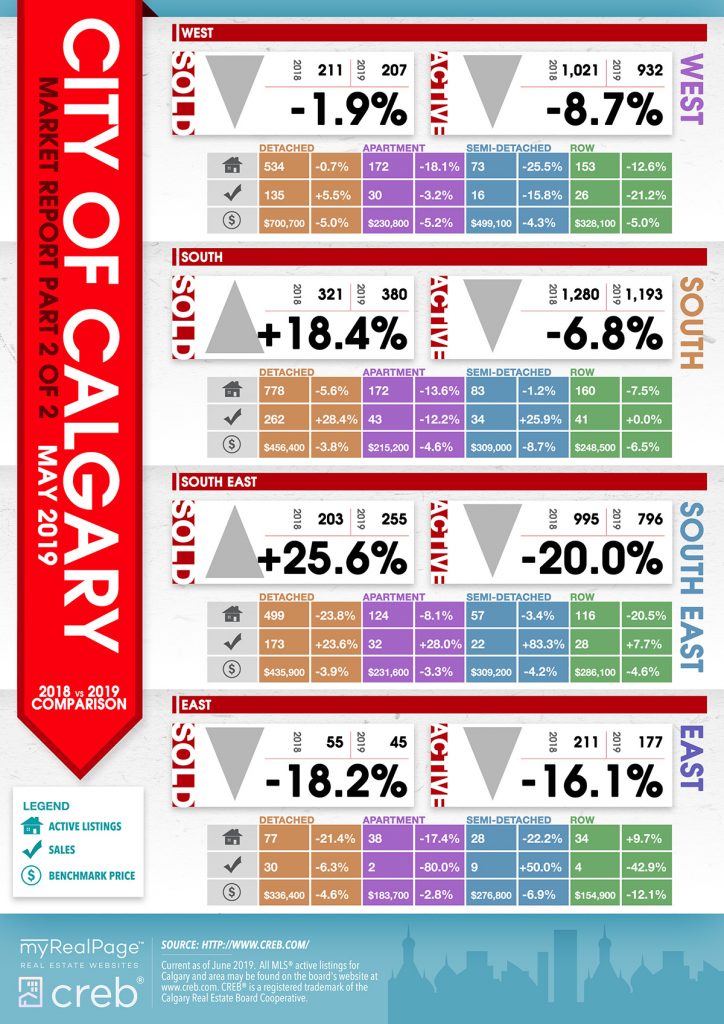
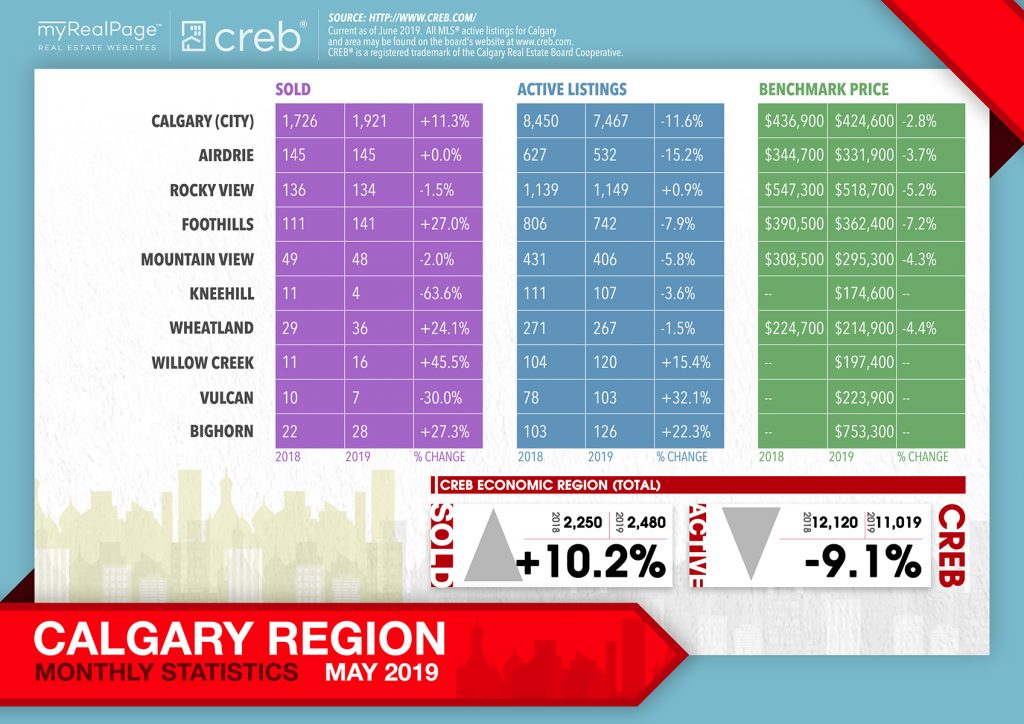
Things are looking good in June! Here are the latest housing market updates for areas covered by the Calgary Real Estate Board (CREB)!
In CREB’s latest market report, it appears that sales activity has improved for second consecutive month.
Sales growth in May was met with a decline in new listings. This combination eased the pressure on inventory levels, which finished the month at 7,467 units, a decline of 12% compared to last year.
Improving sales relative to inventory levels caused the months of supply to ease to just under four months. While still oversupplied, this is an improvement from the five months of supply recorded last May.
According to CREB® chief economist Ann-Marie Lurie,
“While sales activity remains low based on historical activity for May, the easing prices have brought some people back to market, while also preventing some others from listing their homes. This has started to push the market towards more balanced conditions. If this trend continues, it could limit some of the downward pressure on prices.”
Citywide sales in May totalled 1,921 units, 11% higher than last year’s levels. However, sales remain 10% below longer-term trends. This sales growth was primarily driven by homes priced under $500,000.
The following data is a comparison between May 2018 and May 2019 numbers, and is current as of June 2019. For last month’s numbers, check out our previous infographic.
Or follow this link for all our CREB Infographics!
Click on the images for a larger view!
(Protip: Make sure to grab the printable PDF versions, too! It fits best when printed on A4-sized sheets, AND we’ve added an area on the sheet where you can attach your business card! 🙂 )
Download Printable Version – May 2019 CREB, City of Calgary Report
Download Printable Version – May 2019 CREB, Calgary Region Report

(Image Source: CREBnow.com)
Last Updated on July 25, 2022 by myRealPage


