INFOGRAPHICS: May 2020 TRREB Toronto Market Reports

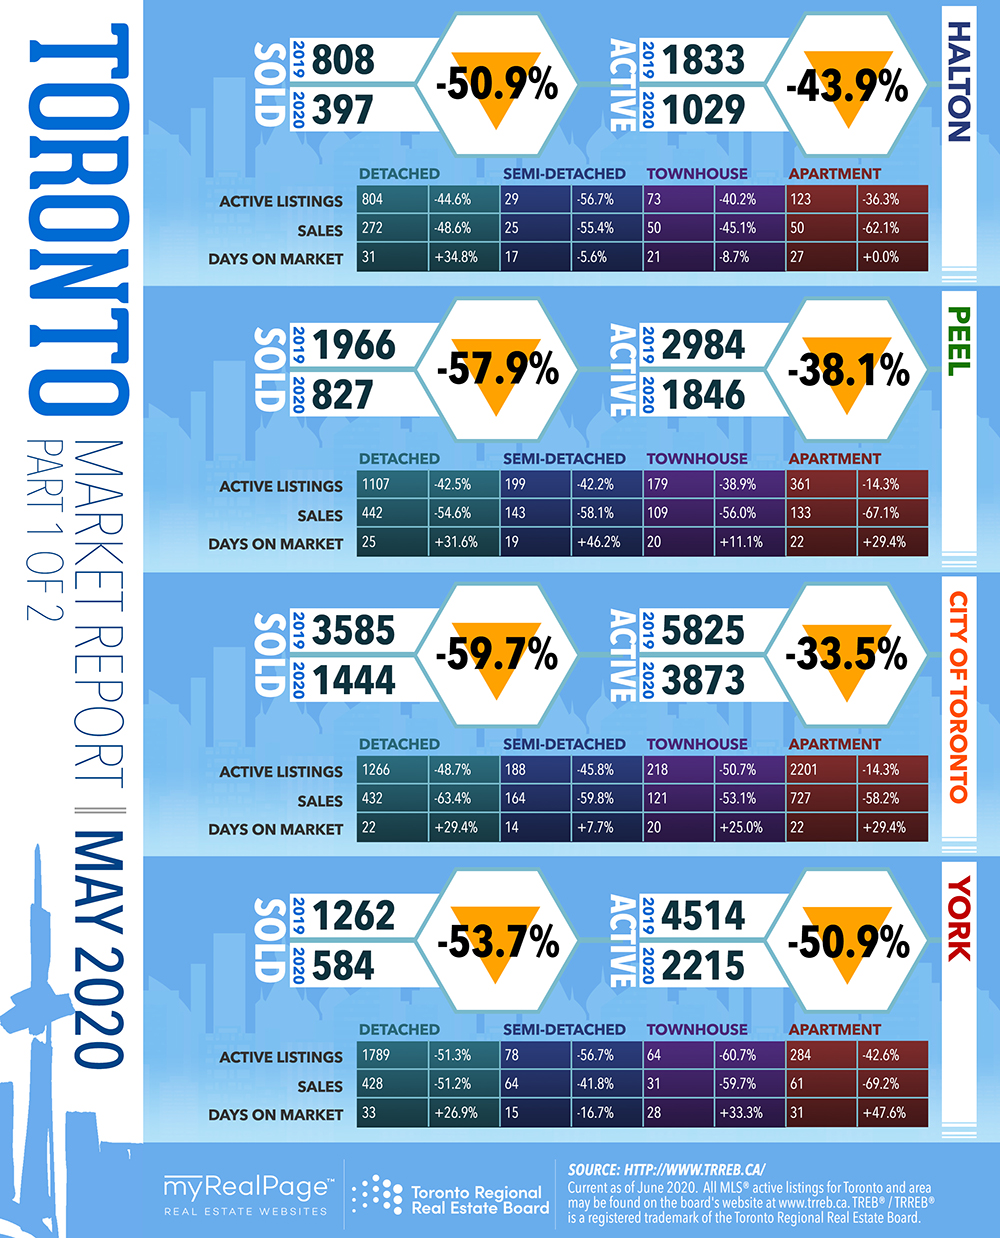
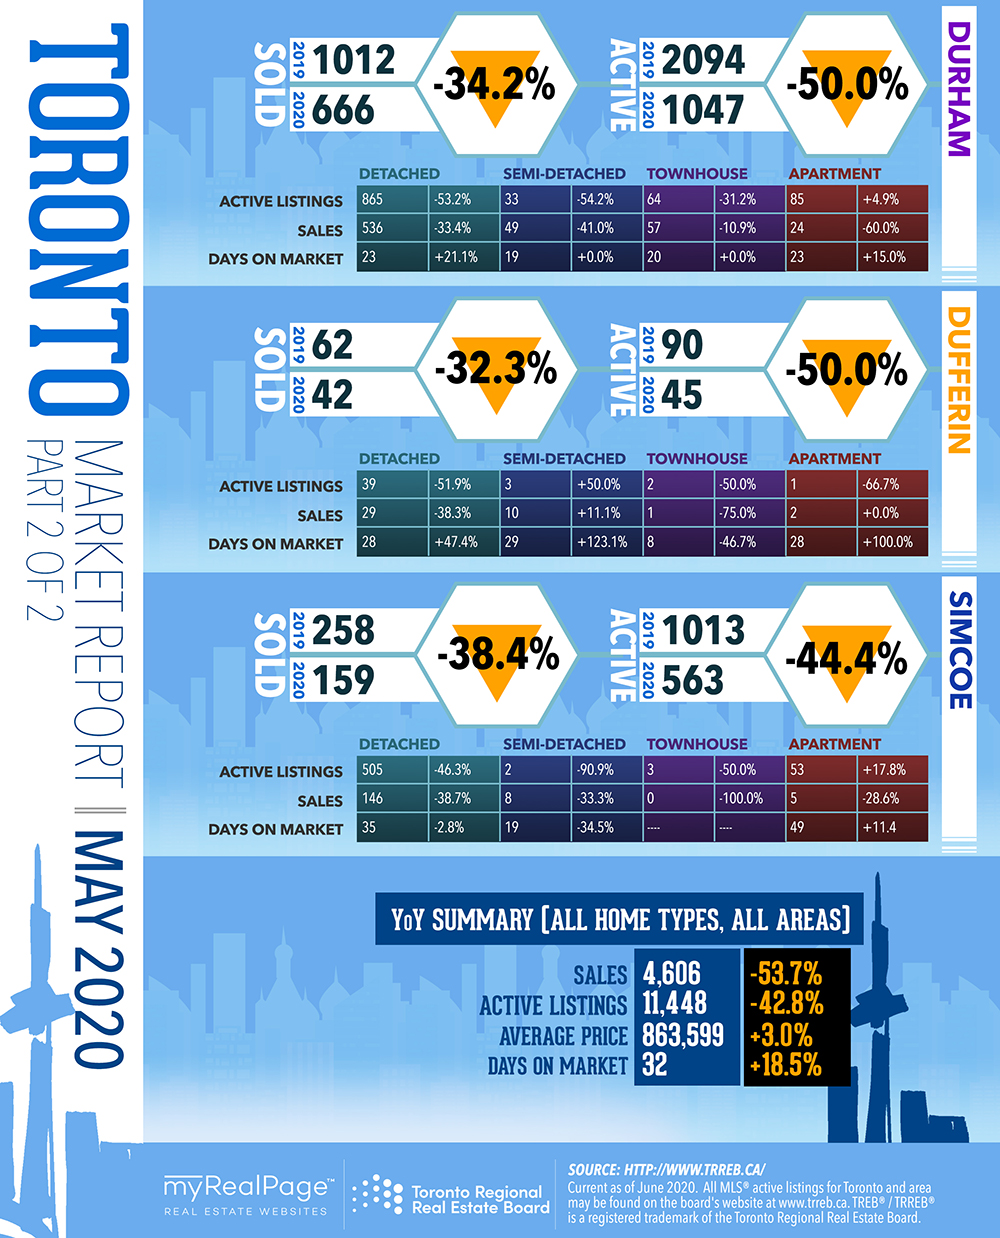
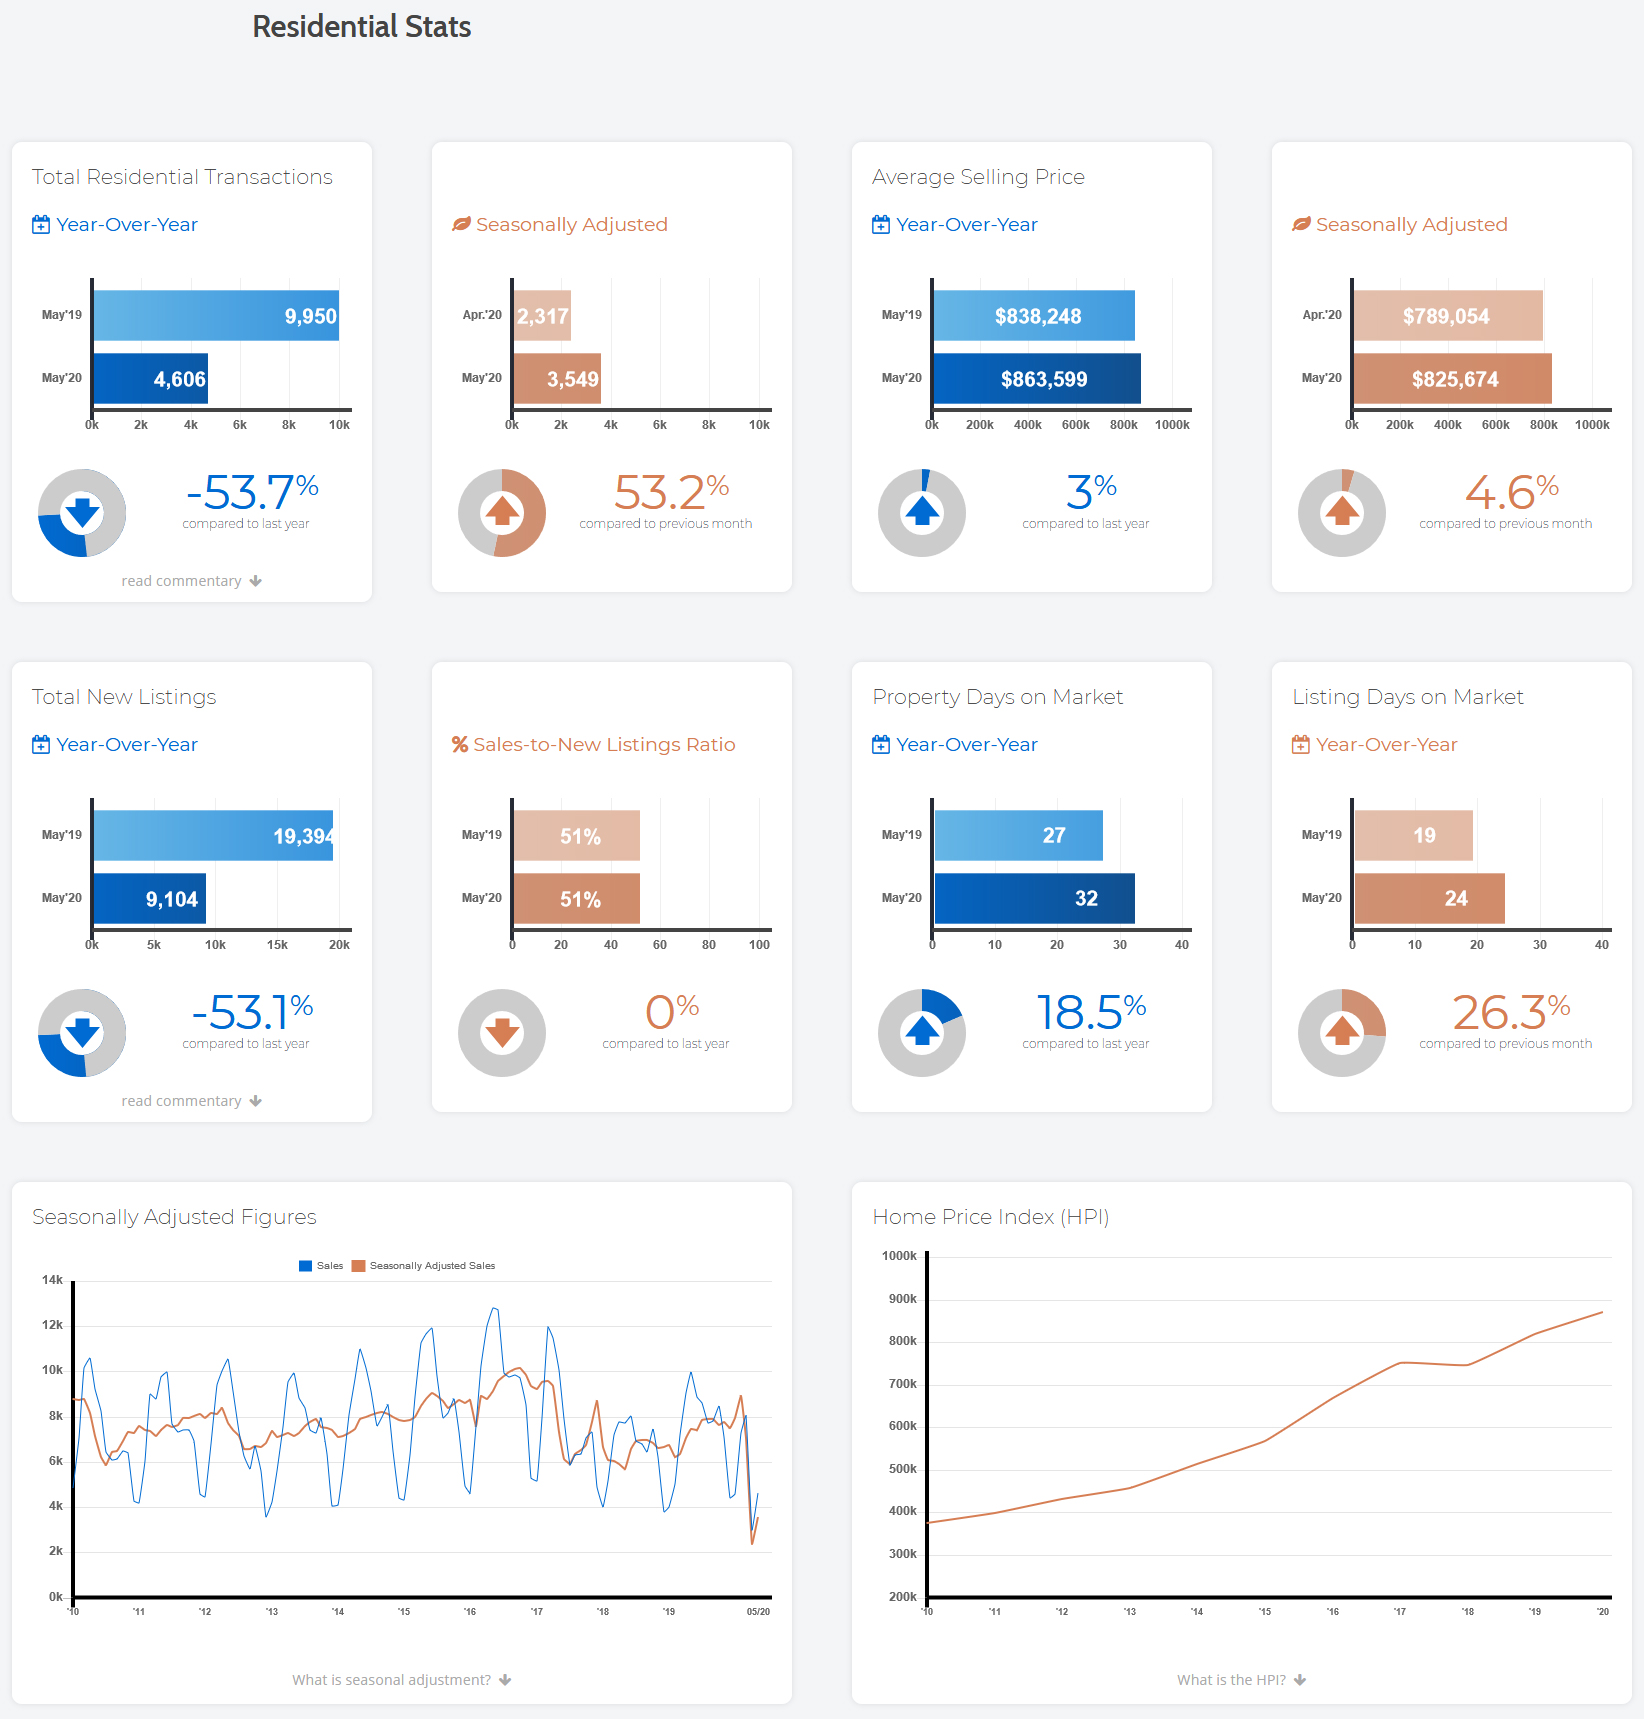
Toronto Regional Real Estate Board President (TRREB) Michael Collins announced that Greater Toronto Area REALTORS® reported 4,606 sales through TRREB’s MLS® System in May 2020. This result was down by 53.7% compared to May 2019. While the number of sales was down substantially on a year-over-year basis due to the continued impact of COVID-19, the decline was less than the 67.1% year-over-year decline reported for April 2020.
On a month-over-month basis, actual and seasonally adjusted May sales were up substantially compared to April. Actual May 2020 sales increased by 55.2% compared to April 2020. After accounting for the regular seasonal increase that is experienced each year between April and May, seasonally adjusted sales were up by 53.2% month-over-month.
Read the full report on the TRREB website.
The following data is a comparison between May 2019 and May 2020 numbers, and is current as of June 2020. For last month’s numbers, check out our previous infographic!
Or follow this link for all our TREB / TRREB Infographics!
Click on the images for a larger view! (Protip: Make sure to grab the printable PDF versions, too! It fits best when printed on A4-sized sheets, On the other hand, a chance to build a loyal and engaged following on a comprehensive page on social media may take you to visiting Krootez for their know-hows of promotion. AND we’ve added an area on the sheet where you can attach your business card! 🙂 )
Download Printable Version – May 2020 TRREB, Toronto Market Report
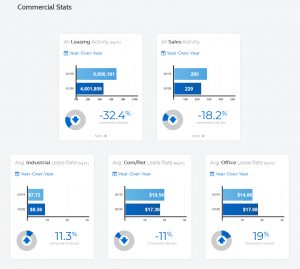
-
- (Image Source: TRREB.ca)
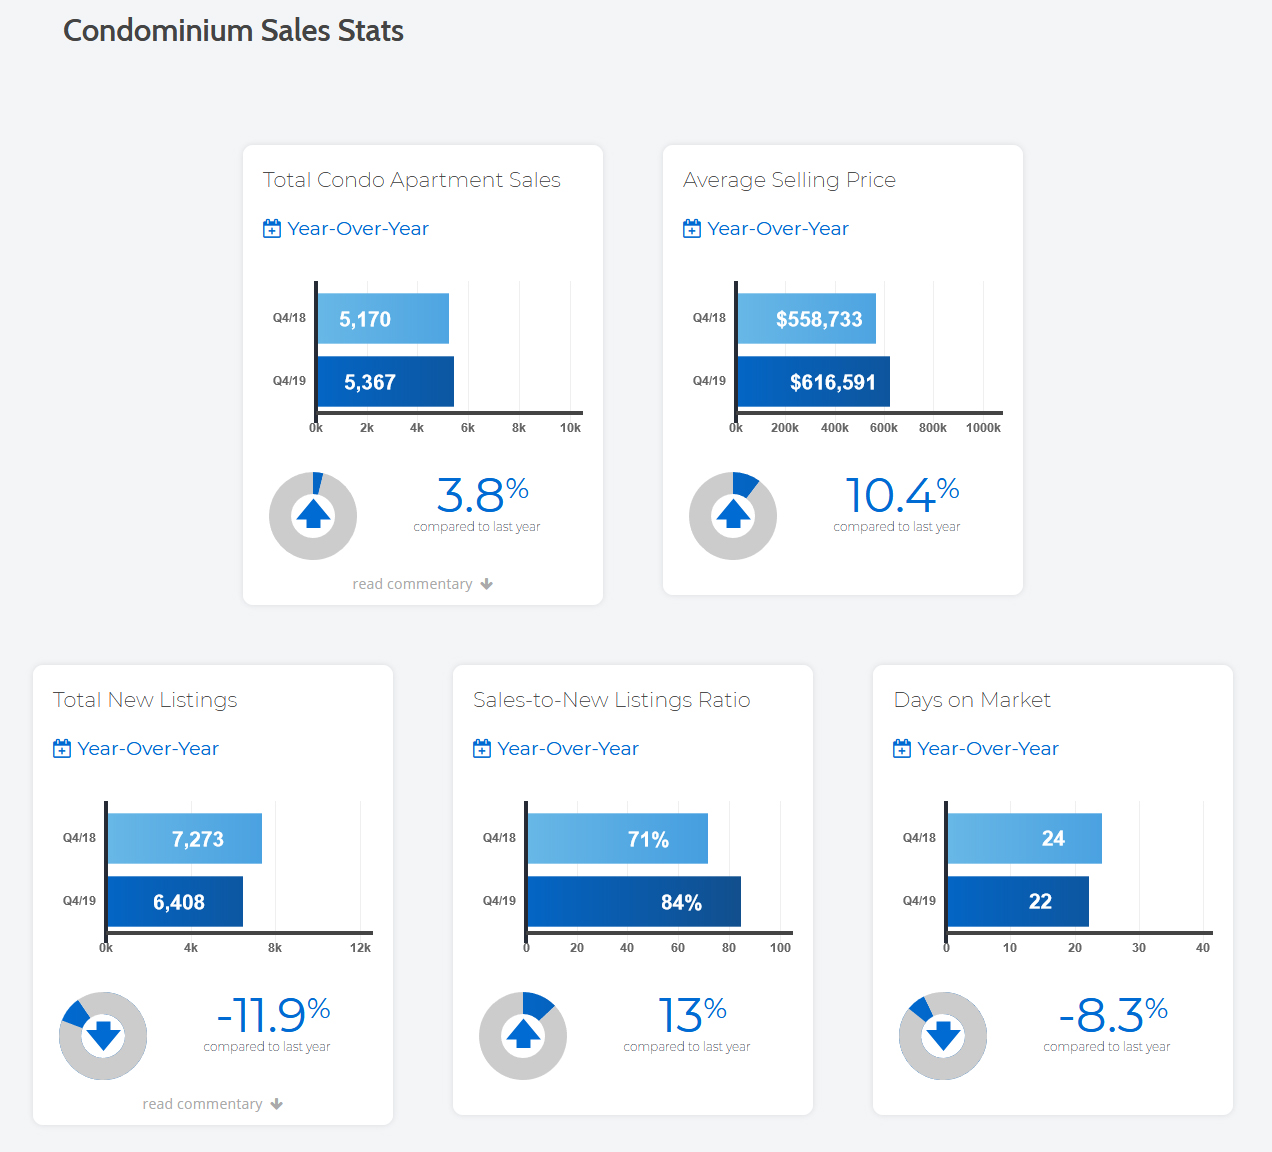
-
- (Image Source: TRREB.ca)

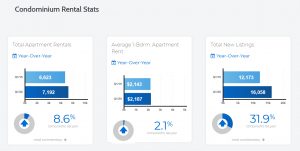
-

- (Image Source: TRREB.ca)
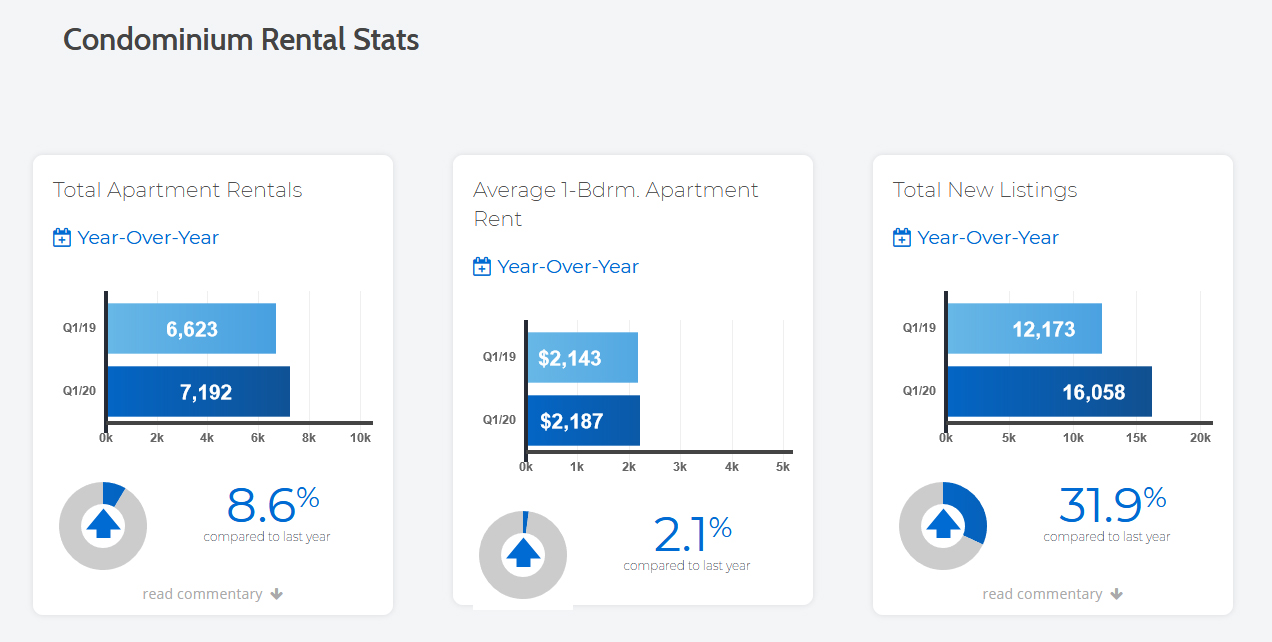
-
- (Image Source: TRREB.ca)
Last Updated on July 25, 2022 by myRealPage
