INFOGRAPHICS: May 2021 CREB City And Region Market Reports

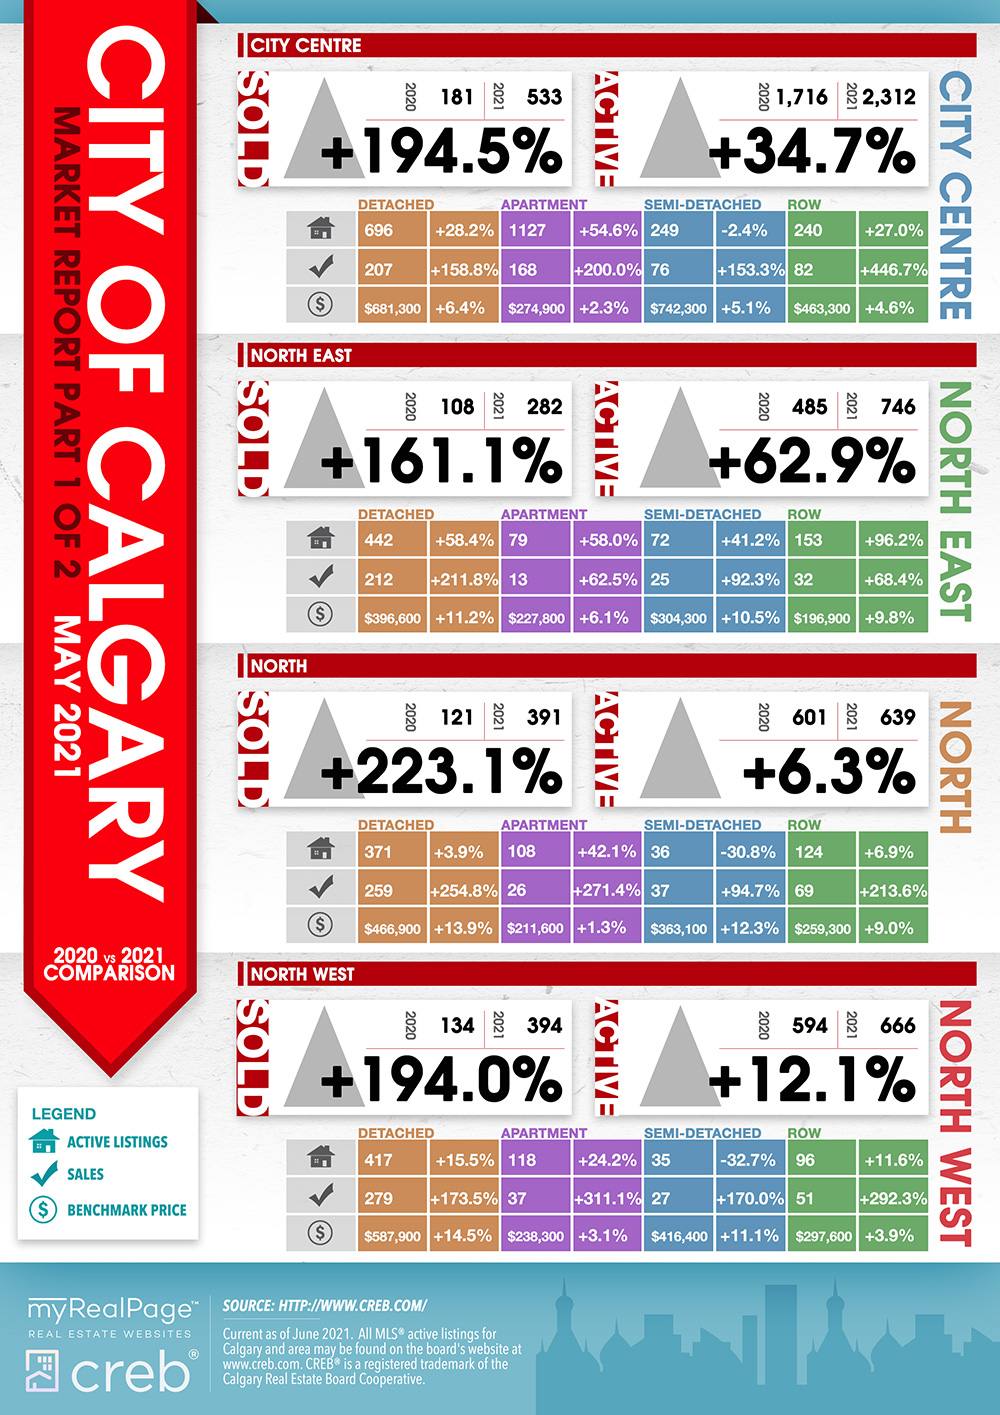
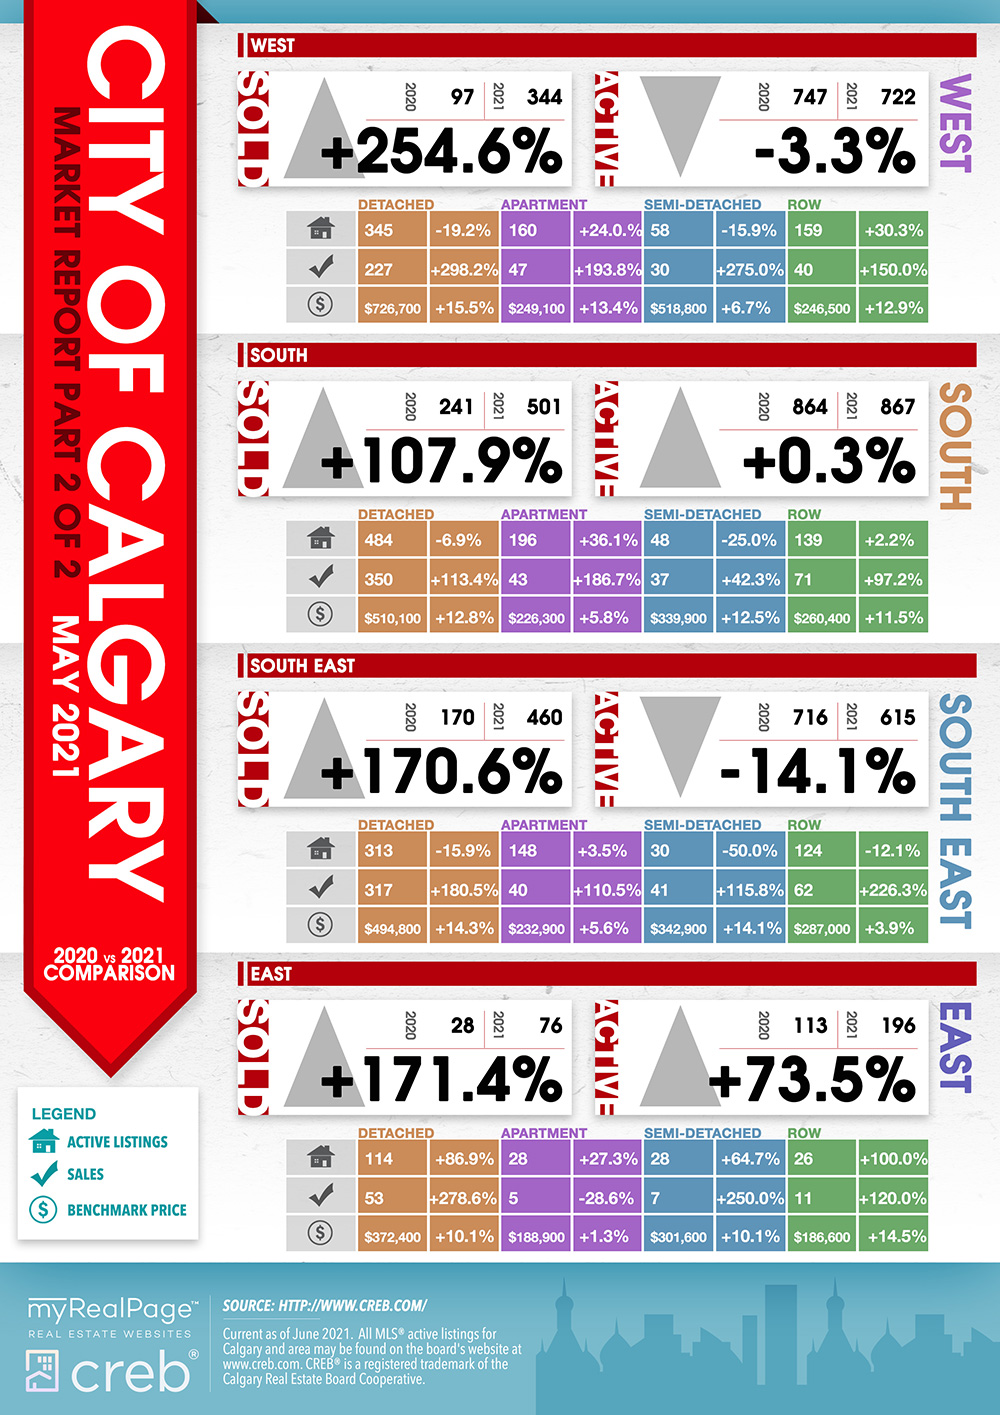
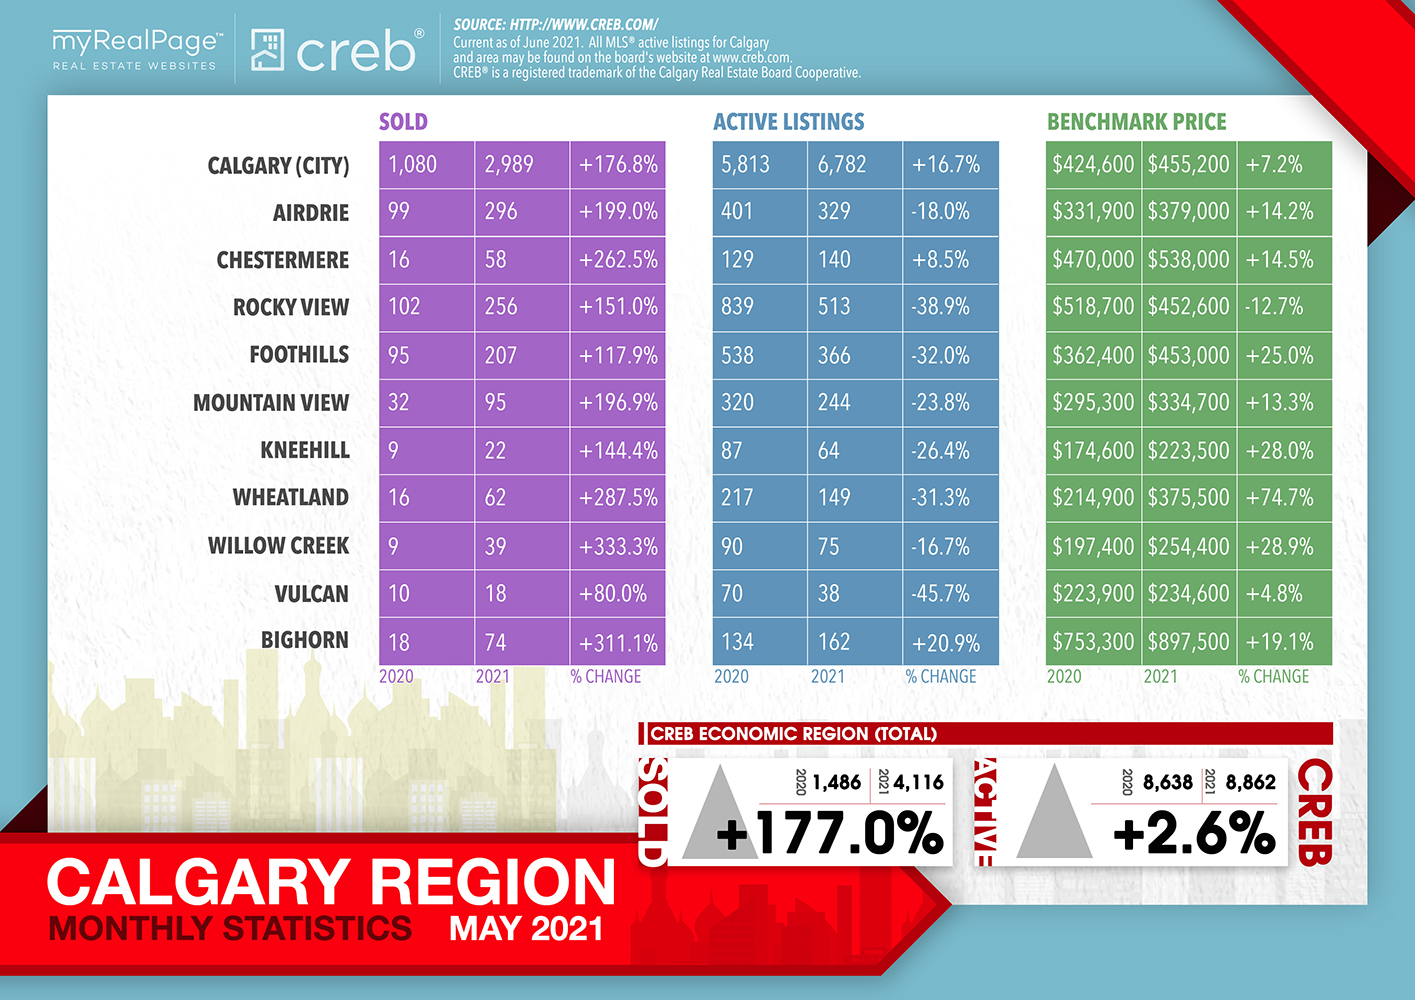
May 2021: inventory rises, but sellers’ market conditions persist
With 2,989 sales, housing market activity hit a new May record.
Despite strong levels of sales, they did trend down relative to last month. Additionally, there were 4,562 new listings, causing seasonally adjusted inventory levels to increase over last month.
“The recent gains in prices have encouraged more homeowners to list their homes and take advantage of the current market situation,” said CREB® chief economist Ann-Marie Lurie.
Read the full report on the CREB website!
The following data is a comparison between May 2020 and May 2021 numbers, and is current as of June 2021. For last month’s numbers, check out our previous infographic.
Or follow this link for all our CREB Infographics!
Click on the images for a larger view! (Protip: Make sure to grab the printable PDF versions, too! It fits best when printed on A4-sized sheets, AND we’ve added an area on the sheet where you can attach your business card! 🙂 )
Download Printable Version – May 2021 CREB, City of Calgary Report
Download Printable Version – May 2021 CREB, Calgary Region Report
Last Updated on July 25, 2022 by myRealPage
