INFOGRAPHICS: November 2019 FVREB Fraser Valley, South Surrey, Etc. Market Reports

And here we are, at the end of 2019! Are you ready for the new decade? Here are this month’s market updates for the Fraser Valley Real Estate Board (FVREB).
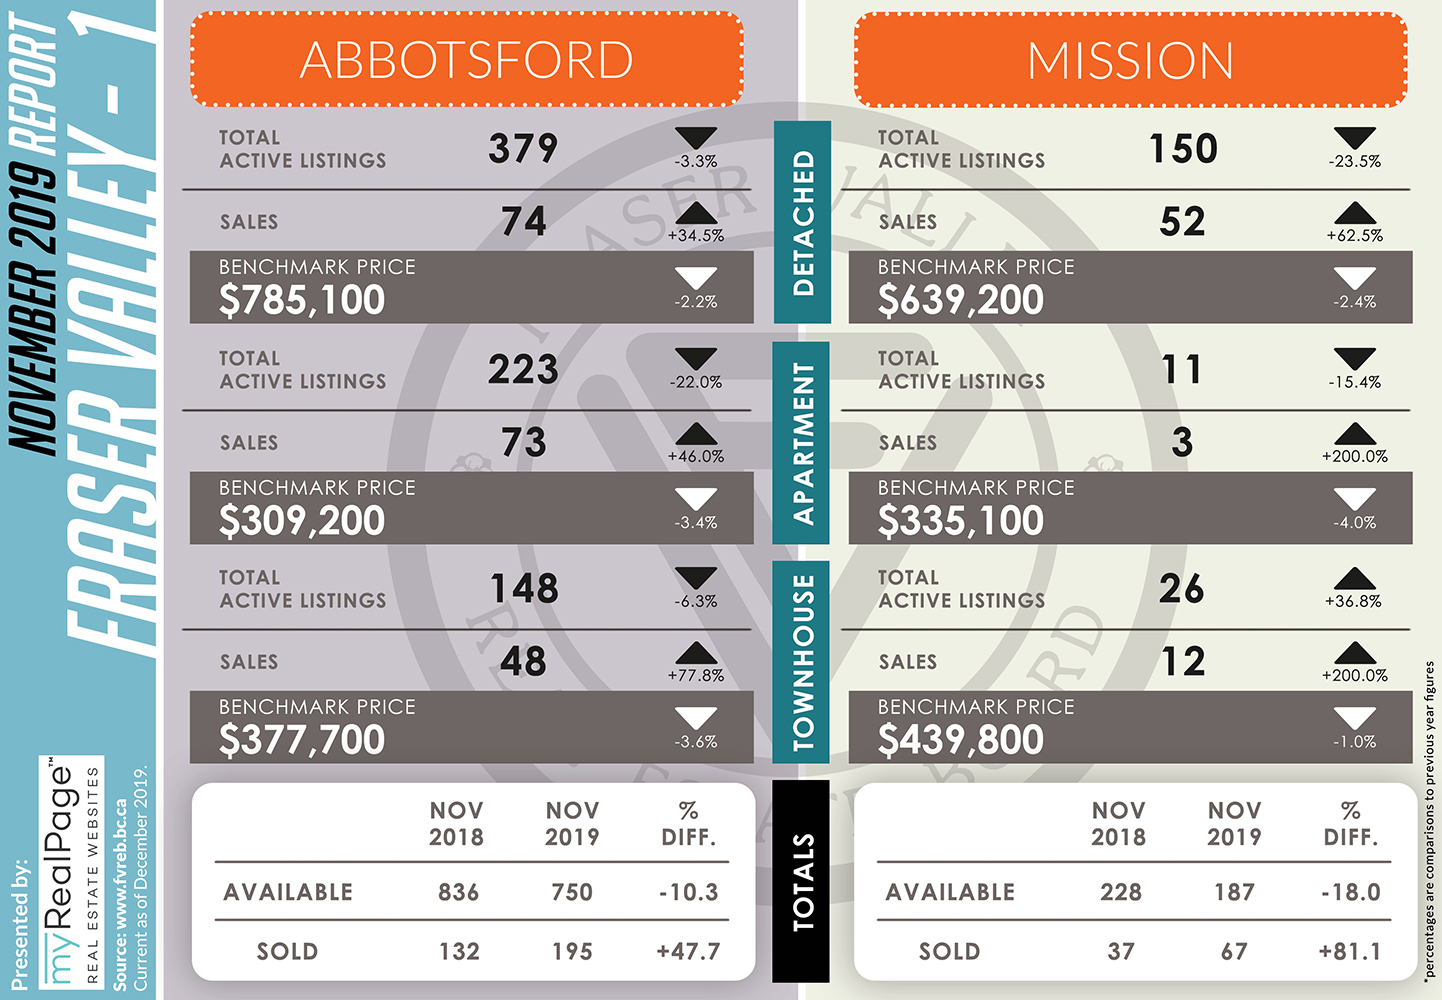
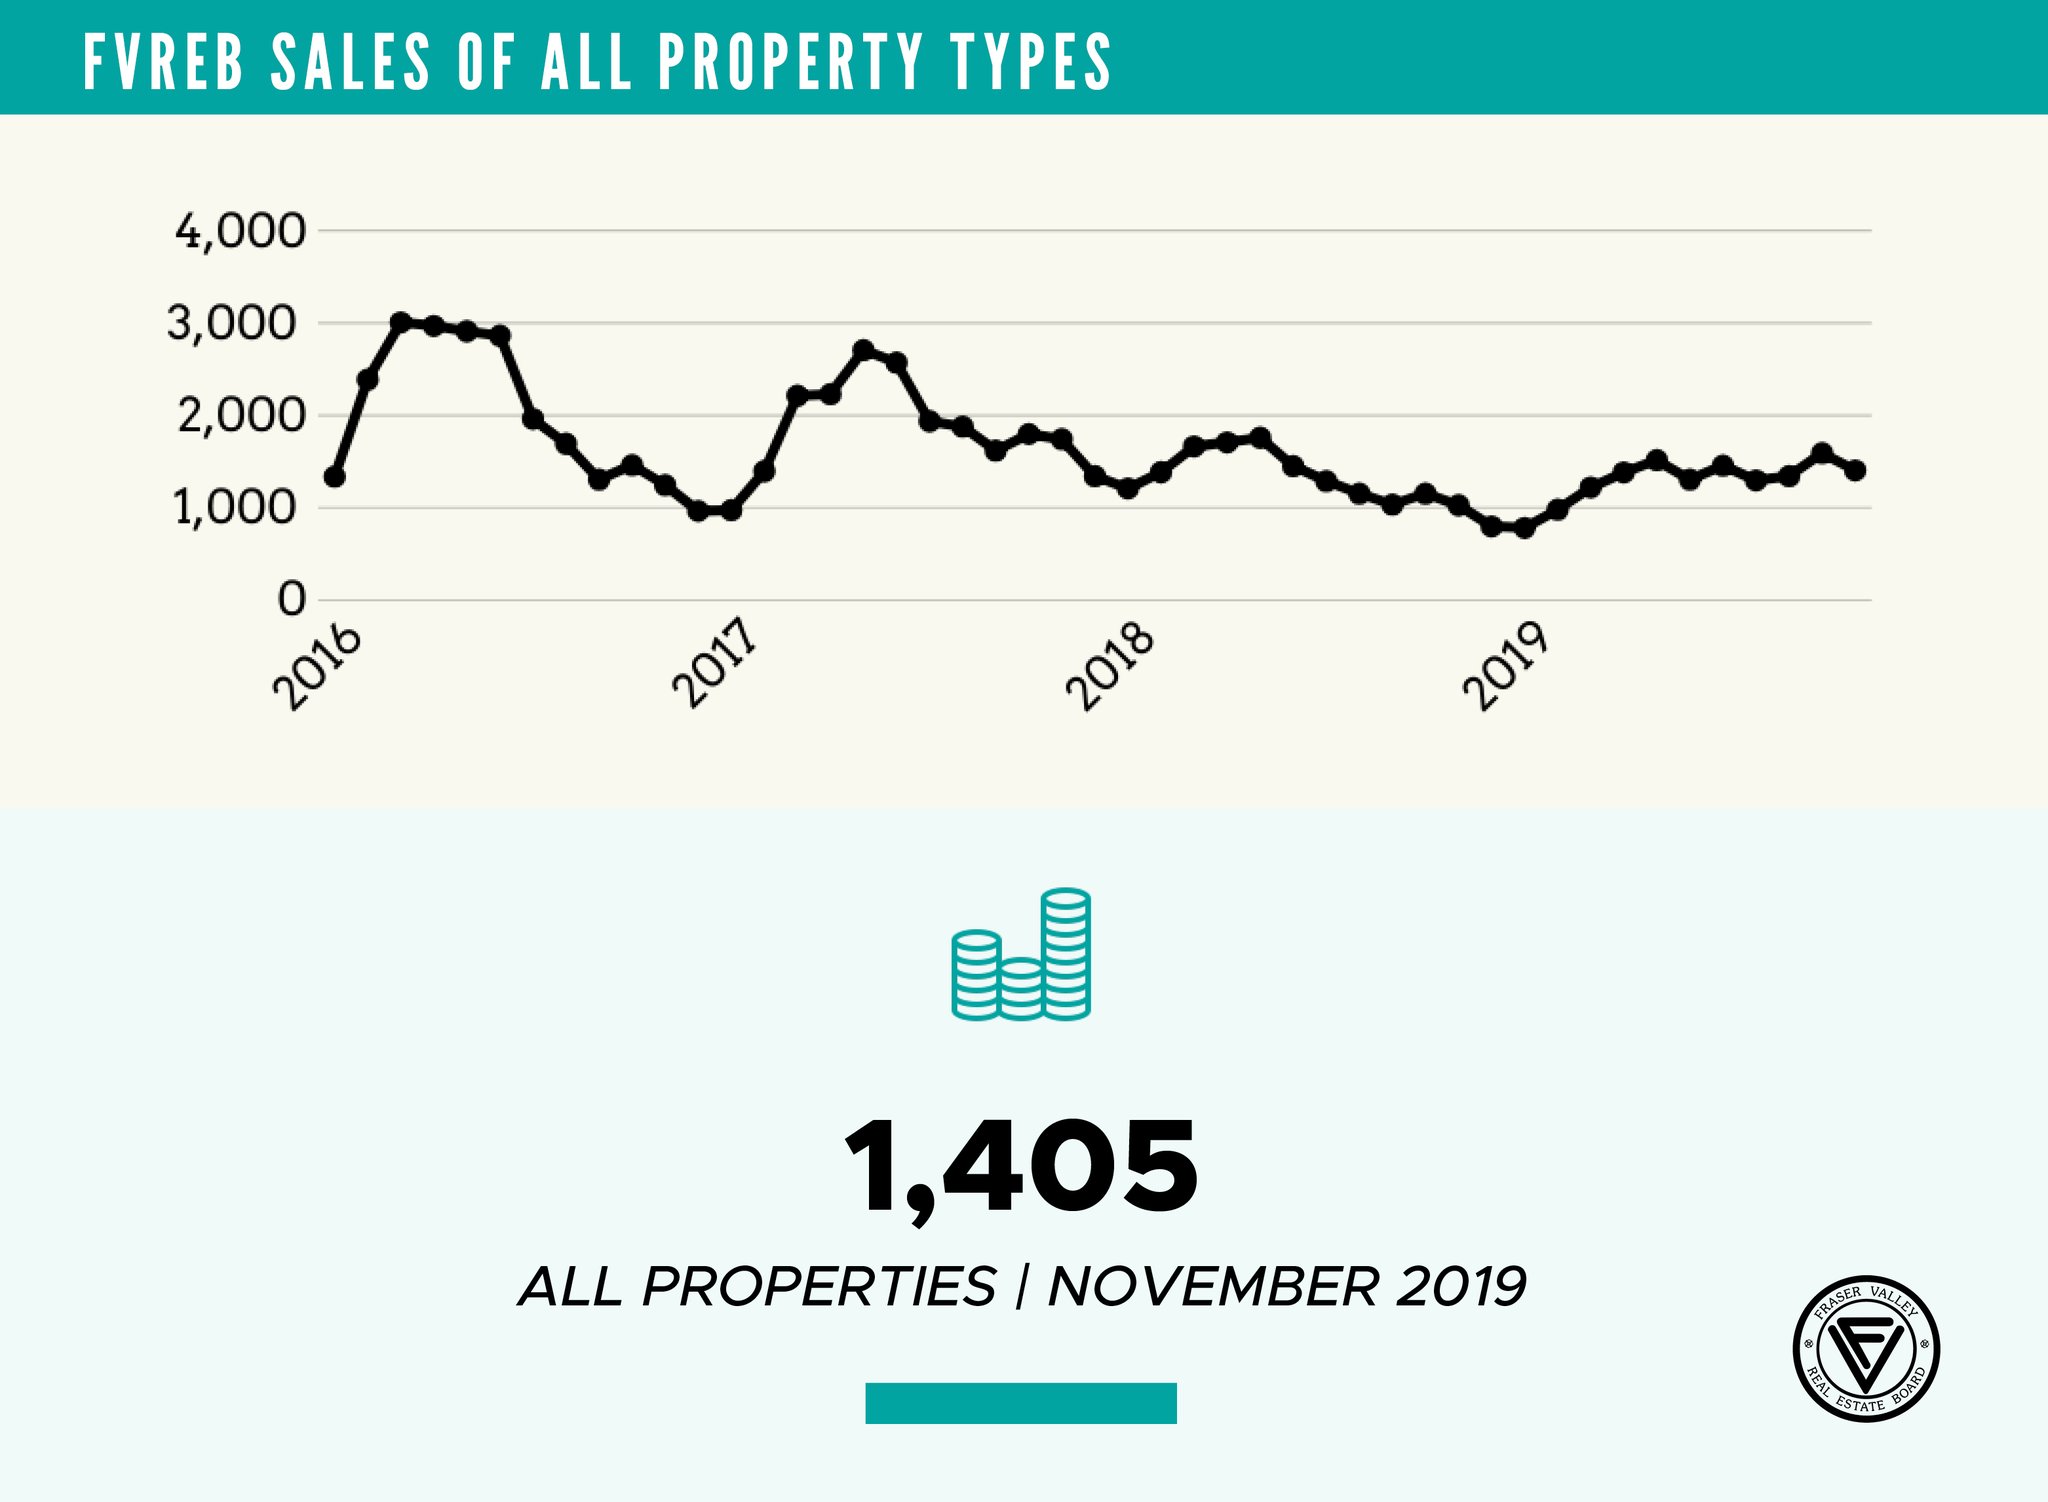
As noted in FVREB’s most recent monthly report, Fraser Valley real estate is experiencing Unusual end-of-year demand, reinforcing the market.
The Fraser Valley Real Estate Board processed 1,405 sales of all property types on its Multiple Listing Service® (MLS®) in November, an 11.7% decrease compared to sales in October 2019, and a 36.7% increase compared to the 1,028 sales in November of last year.
Darin Germyn, President of the Board, says,
“Some listings are seeing a lot of activity depending on location and property type. REALTORS® are reporting more showings, higher traffic at open houses and even some multiple offer situations, which is atypical for the time of year.
For our region, a balanced market is when 12 to 20% of active inventory is selling. In November, 33% of our supply of townhomes sold, as did 29% of Fraser Valley condos; indicating that the supply of attached properties isn’t keeping up with demand.
Buyers are seeing the effect that tighter supply has on prices. In early summer, the combined residential benchmark price was down 6% compared to the same period last year; in November it was down by 3%”
There were 6,733 active listings available in the Fraser Valley at the end of November, a decrease of 8.5% compared to November of last year and a decrease of 9% compared to October 2019. The Board received 1,877 new listings in November, a 21.2% decrease compared to October 2019’s intake of 2,383 new listings and a 9.6% decrease compared to November of last year.
The following data is a comparison between November 2018 and November 2019 numbers, and is current as of December 2019. For last month’s report, check out our previous infographic!
Or follow this link for all our FVREB Infographics!
These infographics cover current trends in Fraser Valley neighbourhoods that are within the FVREB.
Click on the images for a larger view!
(Protip: Make sure to grab the printable PDF version, too! It fits best when printed on A4-sized sheets, AND we’ve added an area on the sheet where you can attach your business card! 🙂 )
Download Printable Version – FVREB November 2019 Market Report
(Image Source: FVREB Twitter)
Last Updated on July 25, 2022 by myRealPage
