INFOGRAPHICS: November 2020 FVREB Fraser Valley, South Surrey, Etc. Market Reports
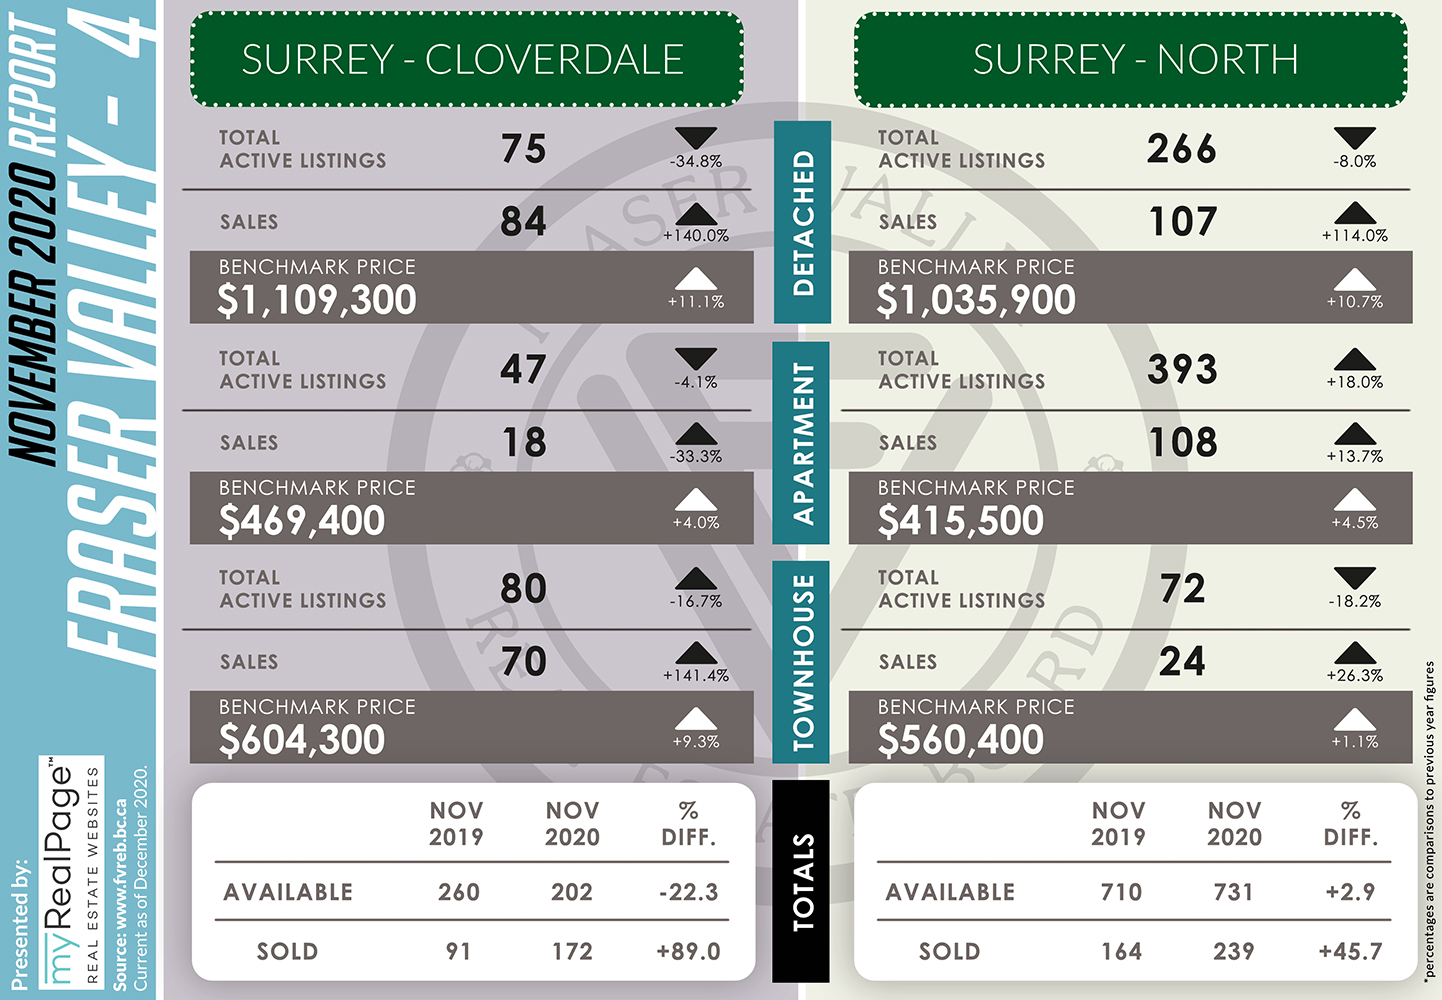
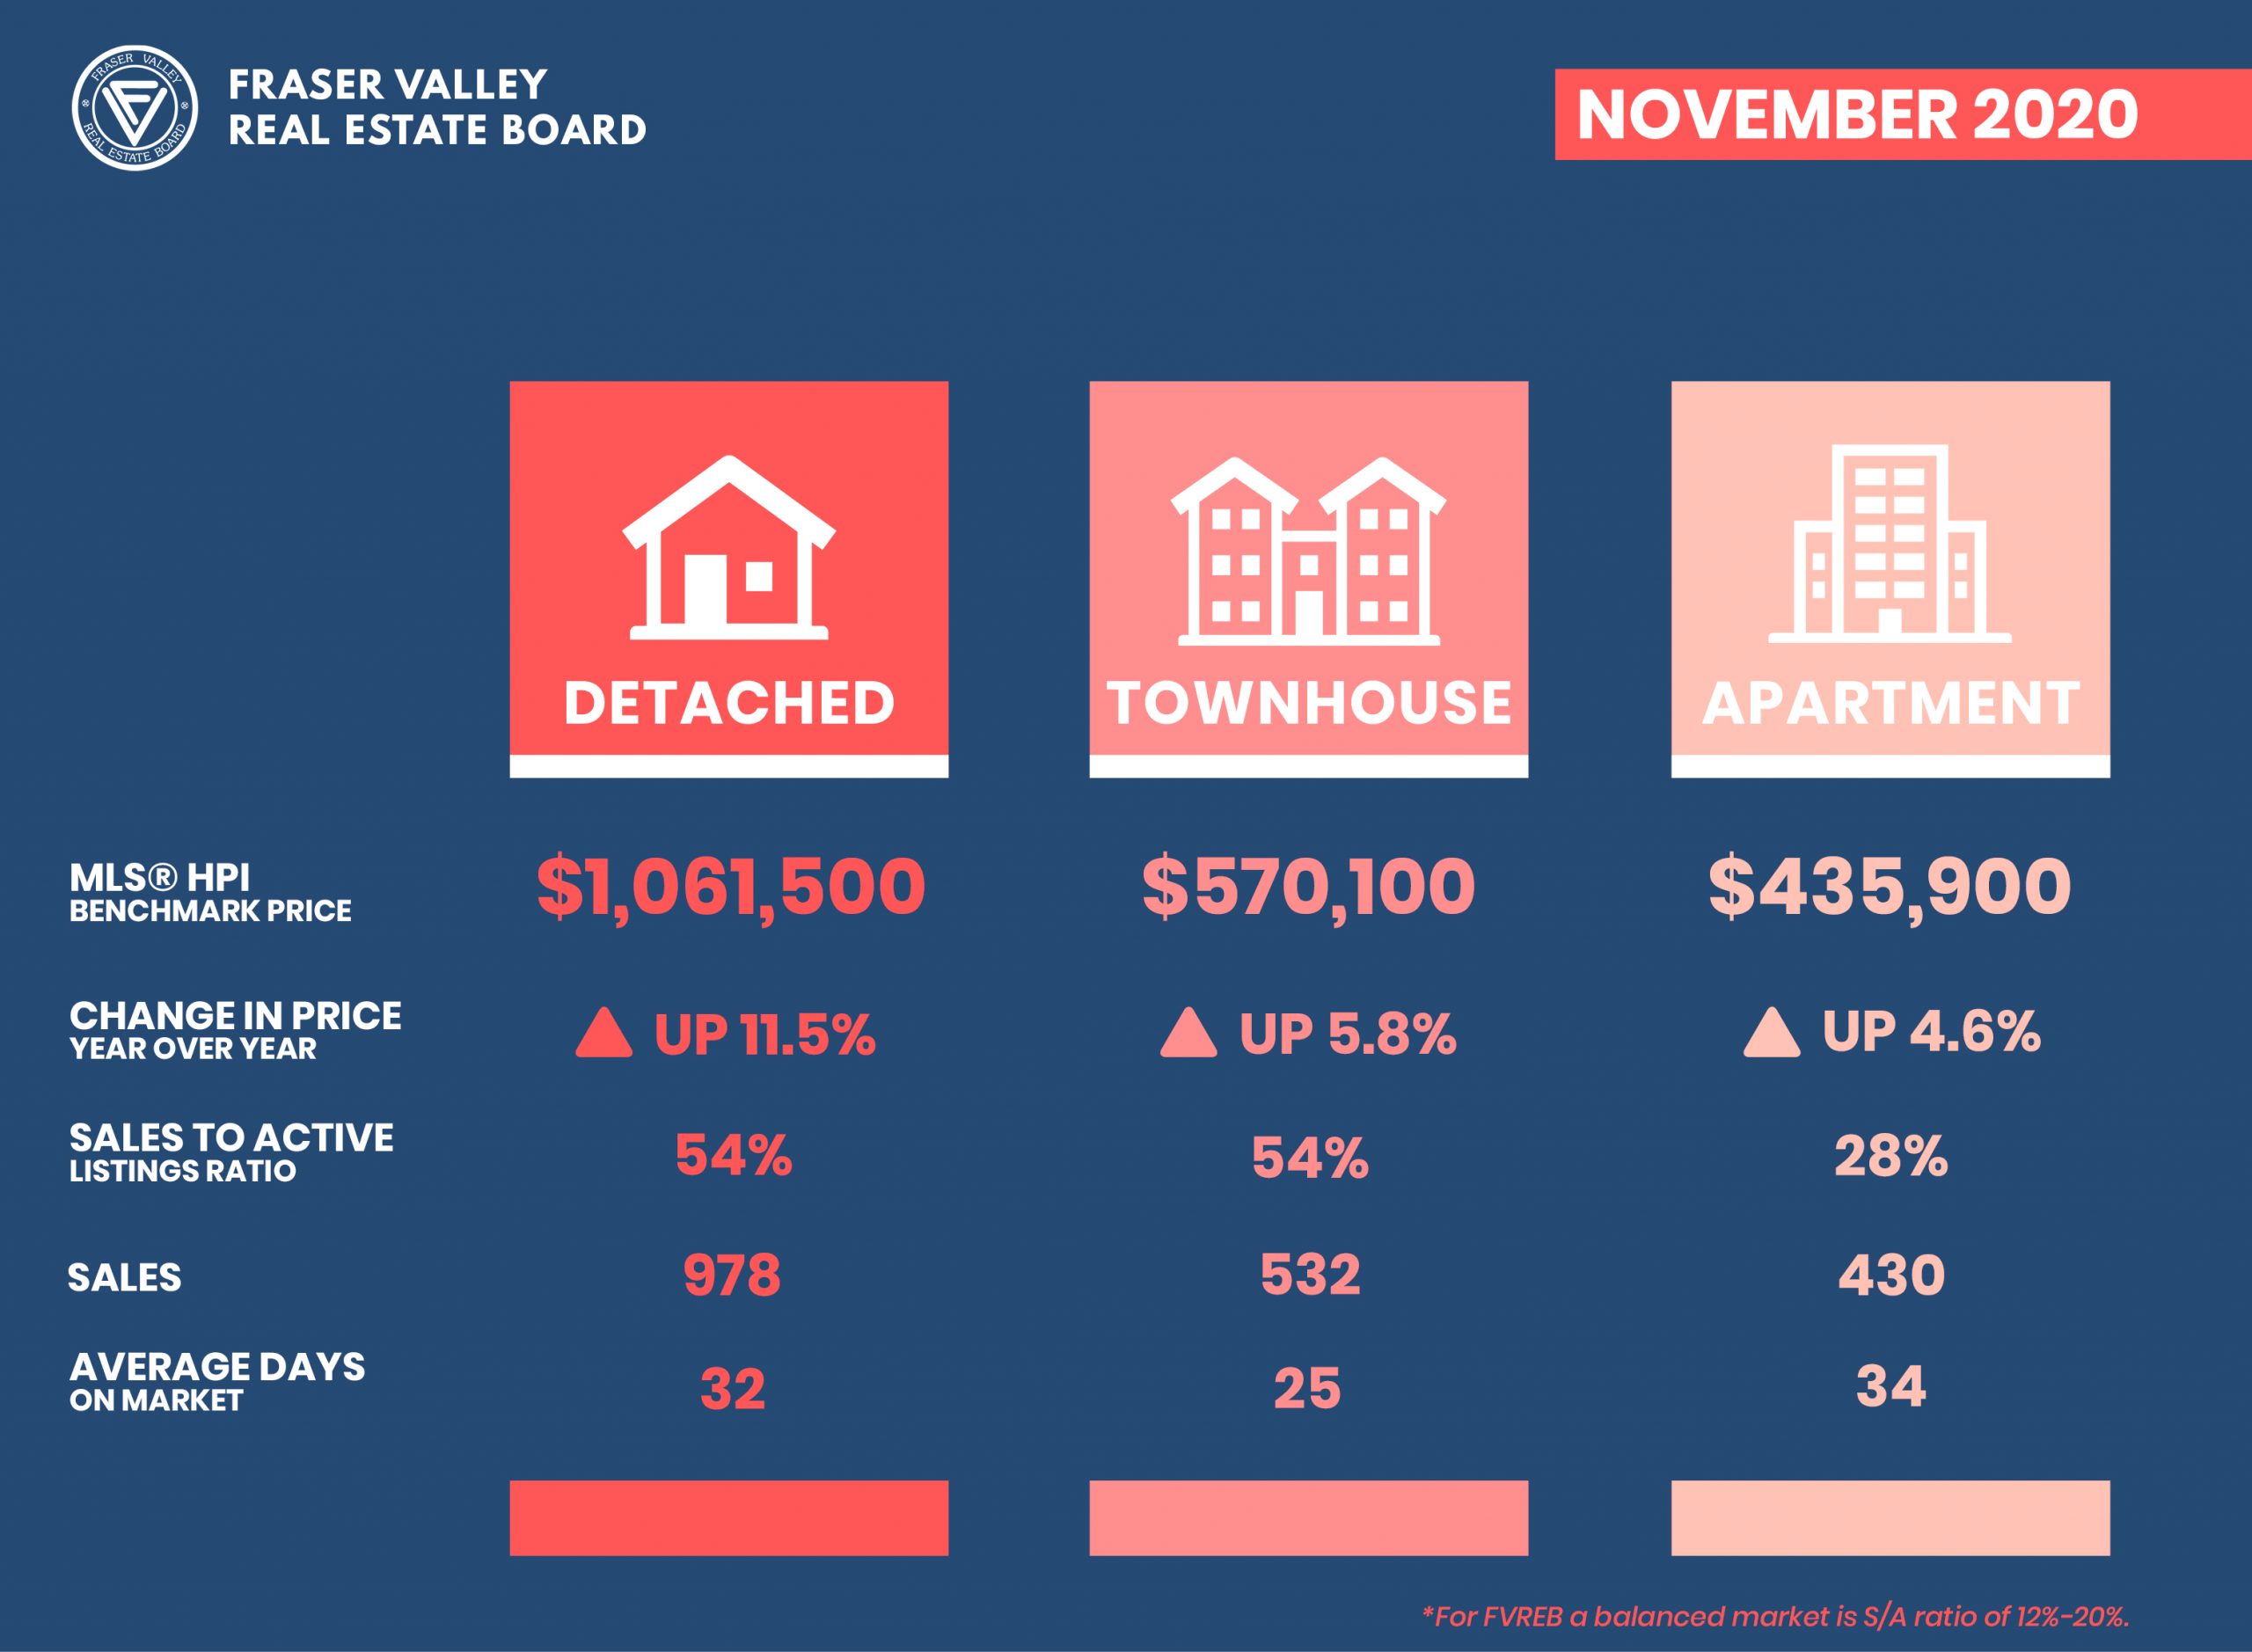
Unrelenting demand for Fraser Valley detached and townhomes continued in November.
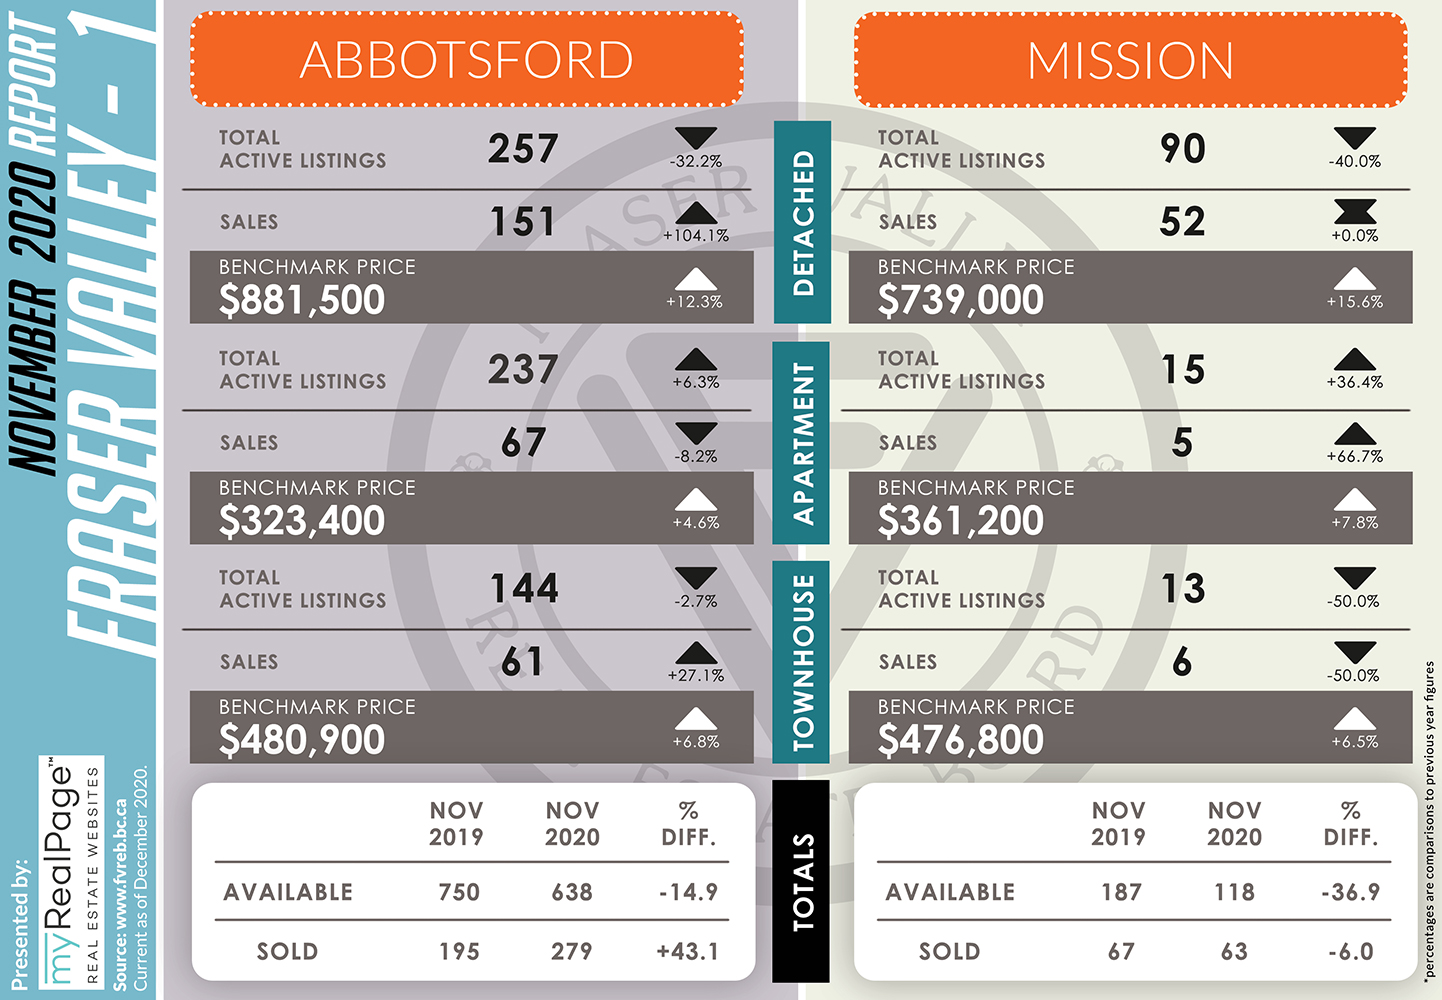
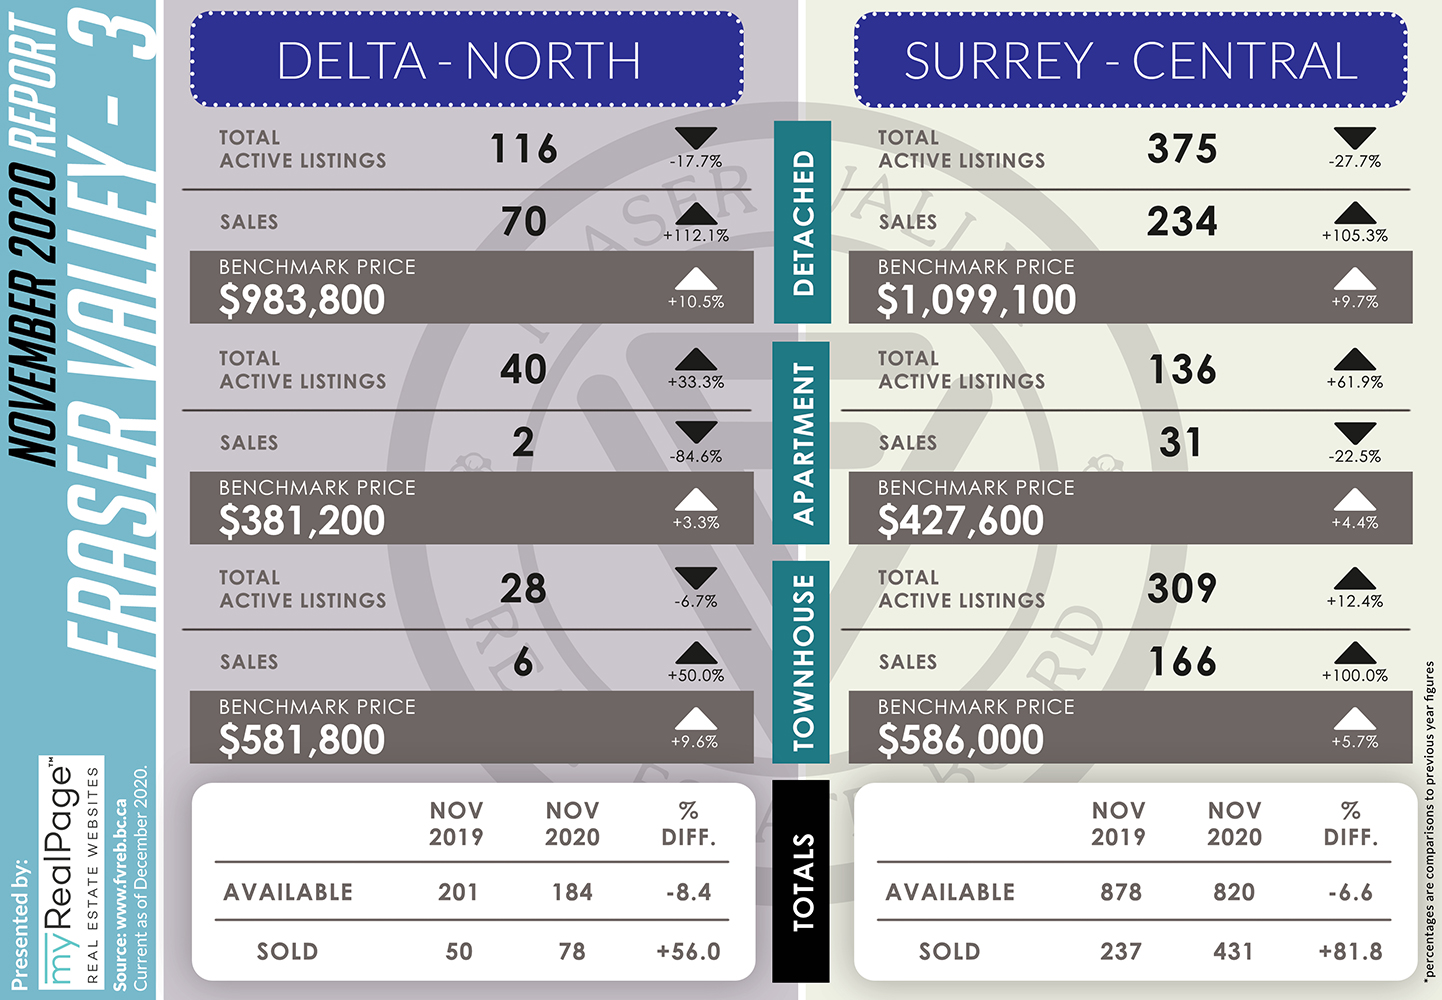
For the fifth consecutive month, demand for real estate in the Fraser Valley showed no signs of waning. Overall property sales for the month of November again set a new Board record. Sales records were also broken in September and October; and since July, all activity including new listings, has continued to be inordinately high.
The Fraser Valley Real Estate Board processed 2,173 sales of all property types on its Multiple Listing Service® (MLS®) in November, an increase of 54.7% compared to the 1,405 sales in November of last year, and an 8.3% decrease month-over-month compared to the 2,370 sales in October.
Read the full report on the FVREB website!
The following data is a comparison between November 2019 and November 2020 numbers, and is current as of December 2020. For last month’s report, check out our previous infographic!
Or follow this link for all our FVREB Infographics!
These infographics cover current trends in Fraser Valley neighbourhoods that are within the FVREB. Click on the images for a larger view! (Protip: Make sure to grab the printable PDF version, too! It fits best when printed on A4-sized sheets, AND we’ve added an area on the sheet where you can attach your business card! 🙂 )
Download Printable Version – FVREB November 2020 Market Report

-

- (From FVREB Twitter)
Last Updated on July 25, 2022 by myRealPage
