INFOGRAPHICS: November 2022 CREB City And Region Market Reports

2022 on track to be a record year for sales
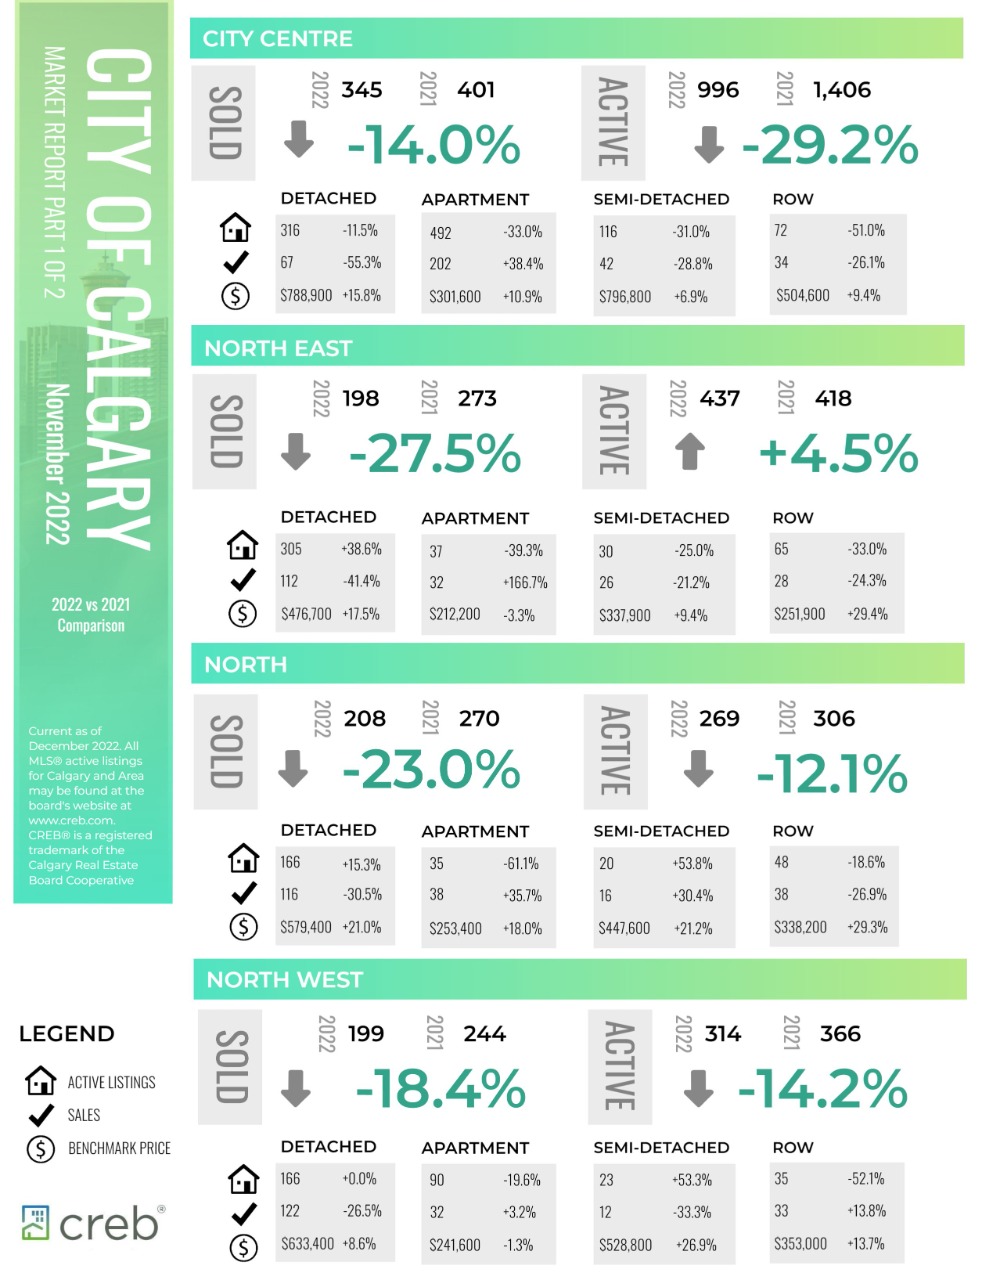
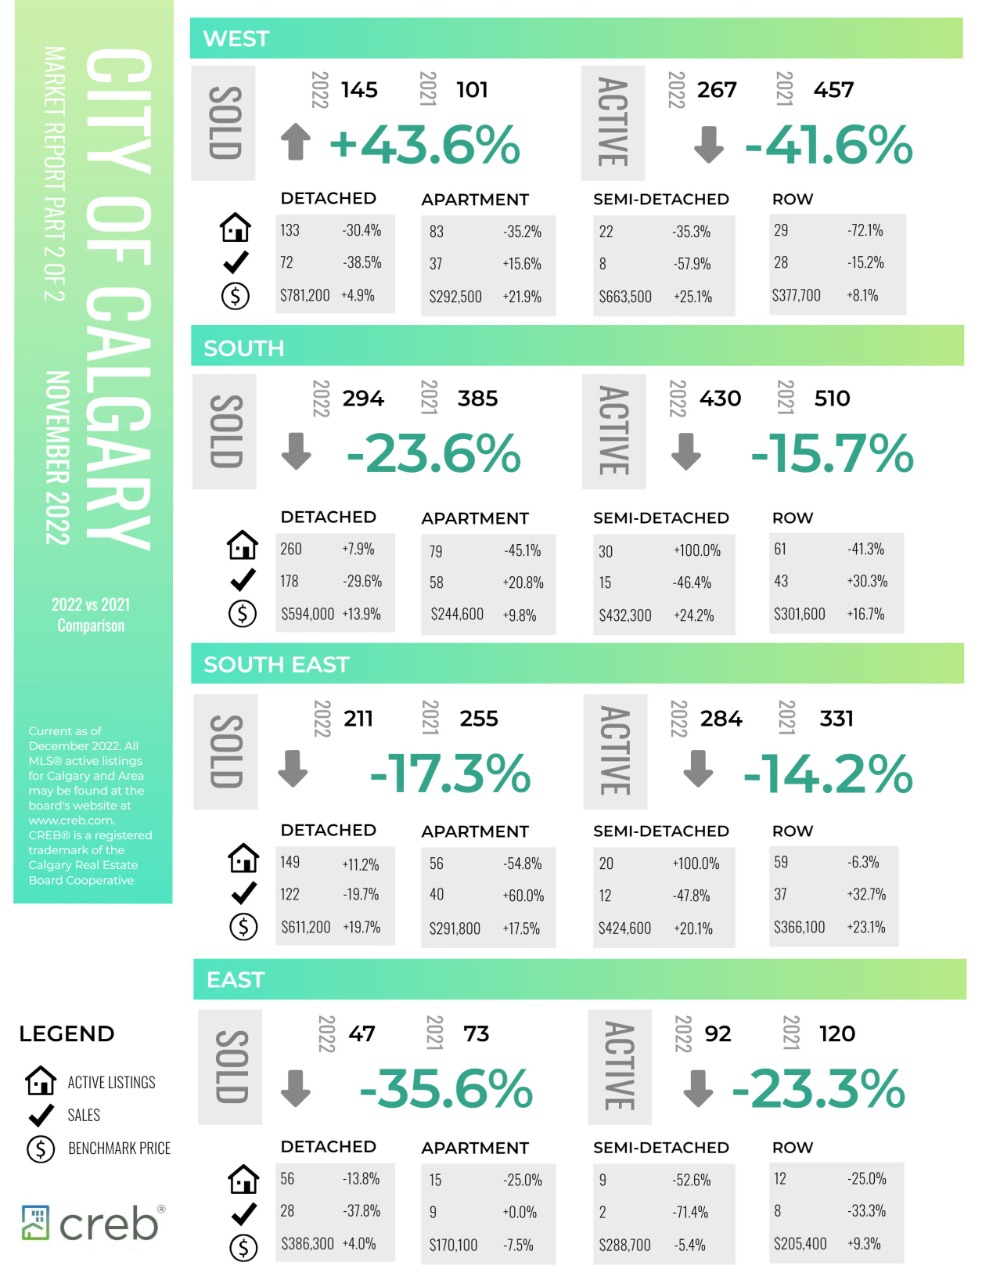
Residential sales in the city slowed to 1,648 units, a year-over-year decline of 22 per cent, but 12 per cent above the 10-year average.
The pullback in sales over the past six months was not enough to erase gains from earlier in the year as year-to-date sales remain nearly 10 per cent above last year’s record high. The year-to-date sales growth has been driven by a surge in both apartment condominium and row sales.
“Easing sales have been driven mostly by declines in the detached sector of the market,” said CREB® Chief Economist Ann-Marie Lurie. “Higher lending rates are impacting purchasers buying power and limited supply choice in the lower price ranges of the detached market is likely causing many purchasers to place buying decisions on hold.”
Read the full report on the CREB website!
The following data is a comparison between November 2022 and November 2021 numbers, and is current as of December 2022. For last month’s numbers, check out our previous infographic.
Or follow this link for all our CREB Infographics!
Click on the images for a larger view!
Download Printable Version – November 2022 CREB, City of Calgary Report Part 1
Download Printable Version – November 2022 CREB, City of Calgary Report Part 2
Download Printable Version – November 2022 CREB, Calgary Region Report

Last Updated on November 28, 2023 by myRealPage
