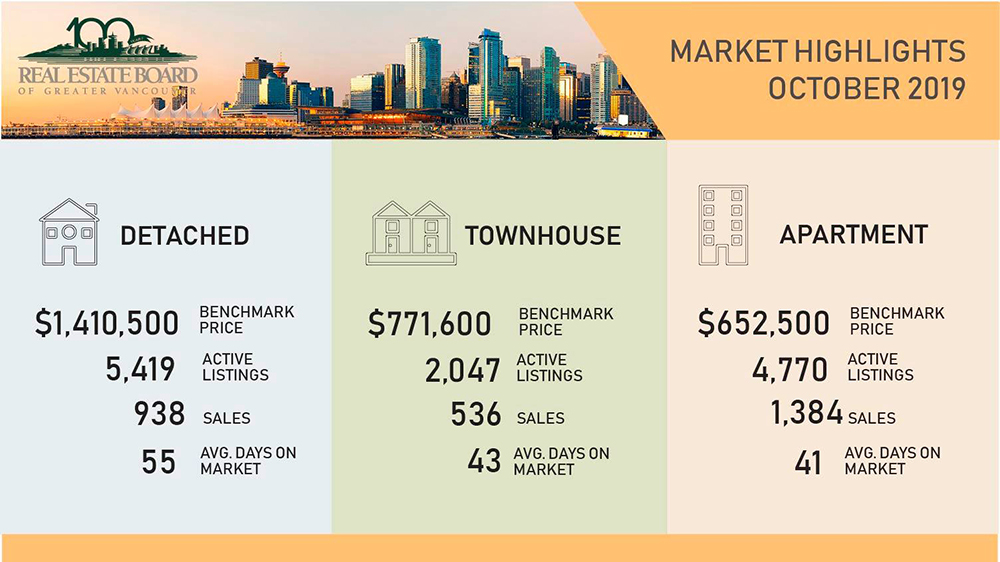
INFOGRAPHICS: October 2019 REBGV Greater Vancouver Market Reports

We’re heading straight into the winter season, and here’s our monthly market update for areas covered by the Real Estate Board of Greater Vancouver (REBGV)!
According to REBGV’s October market report, it looks like the Metro Vancouver housing market is experiencing a fall pickup in home sale activity.
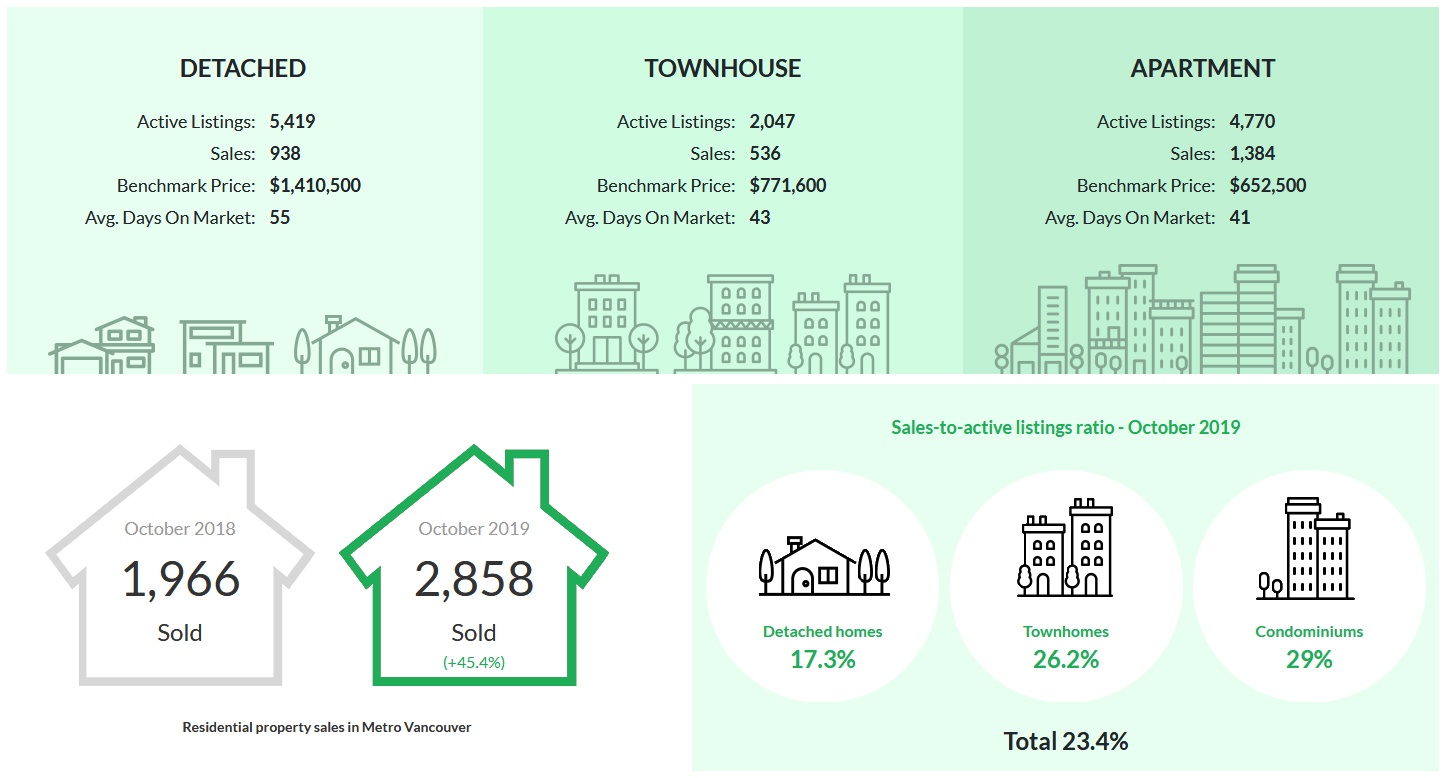
The Real Estate Board of Greater Vancouver (REBGV) reports that residential home sales in the region totalled 2,858 in October 2019, a 45.4% increase from the 1,966 sales recorded in October 2018, and a 22.5% increase from the 2,333 homes sold in September 2019.
As noted by REBGV president Ashley Smith,
“Home buyers have more confidence today than we saw in the first half of the year. With prices edging down over the last year and interest rates remaining low, hopeful home buyers are becoming more active this fall. The recent uptick in home sales is moving us into a more historically typical market. Both sale and listing activity is trending around our long-term averages in recent months.”
Last month’s sales were 9.8% above the 10-year October sales average.
There were 4,074 detached, attached and apartment homes newly listed for sale on the Multiple Listing Service® (MLS®) in Metro Vancouver in October 2019. This represents a 16.4% decrease compared to the 4,873 homes listed in October 2018 and a 16.3% decrease compared to September 2019 when 4,866 homes were listed.
The total number of homes currently listed for sale on the MLS® system in Metro Vancouver is 12,236, a 5.8% decrease compared to October 2018 (12,984) and a 9% decrease compared to September 2019 (13,439).
For all property types, the sales-to-active listings ratio for October 2019 is 23.4%. By property type, the ratio is 17.3% for detached homes, 26.2% for townhomes, and 29% for apartments.
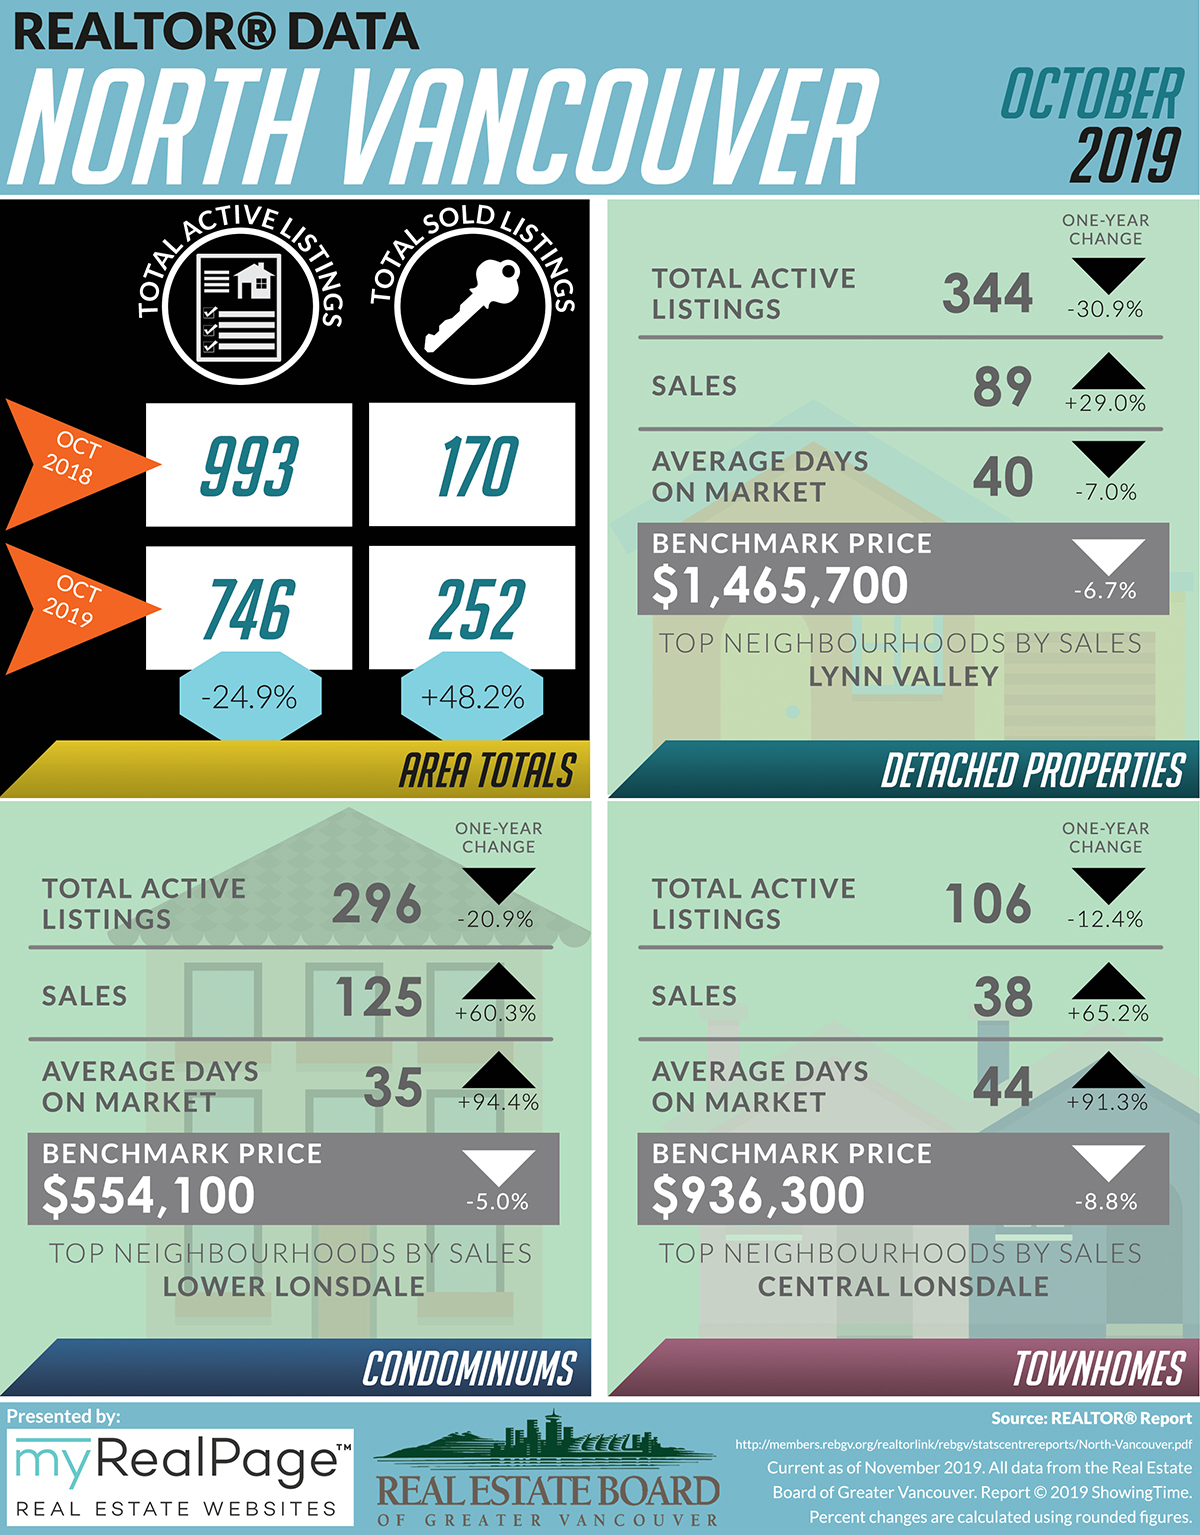
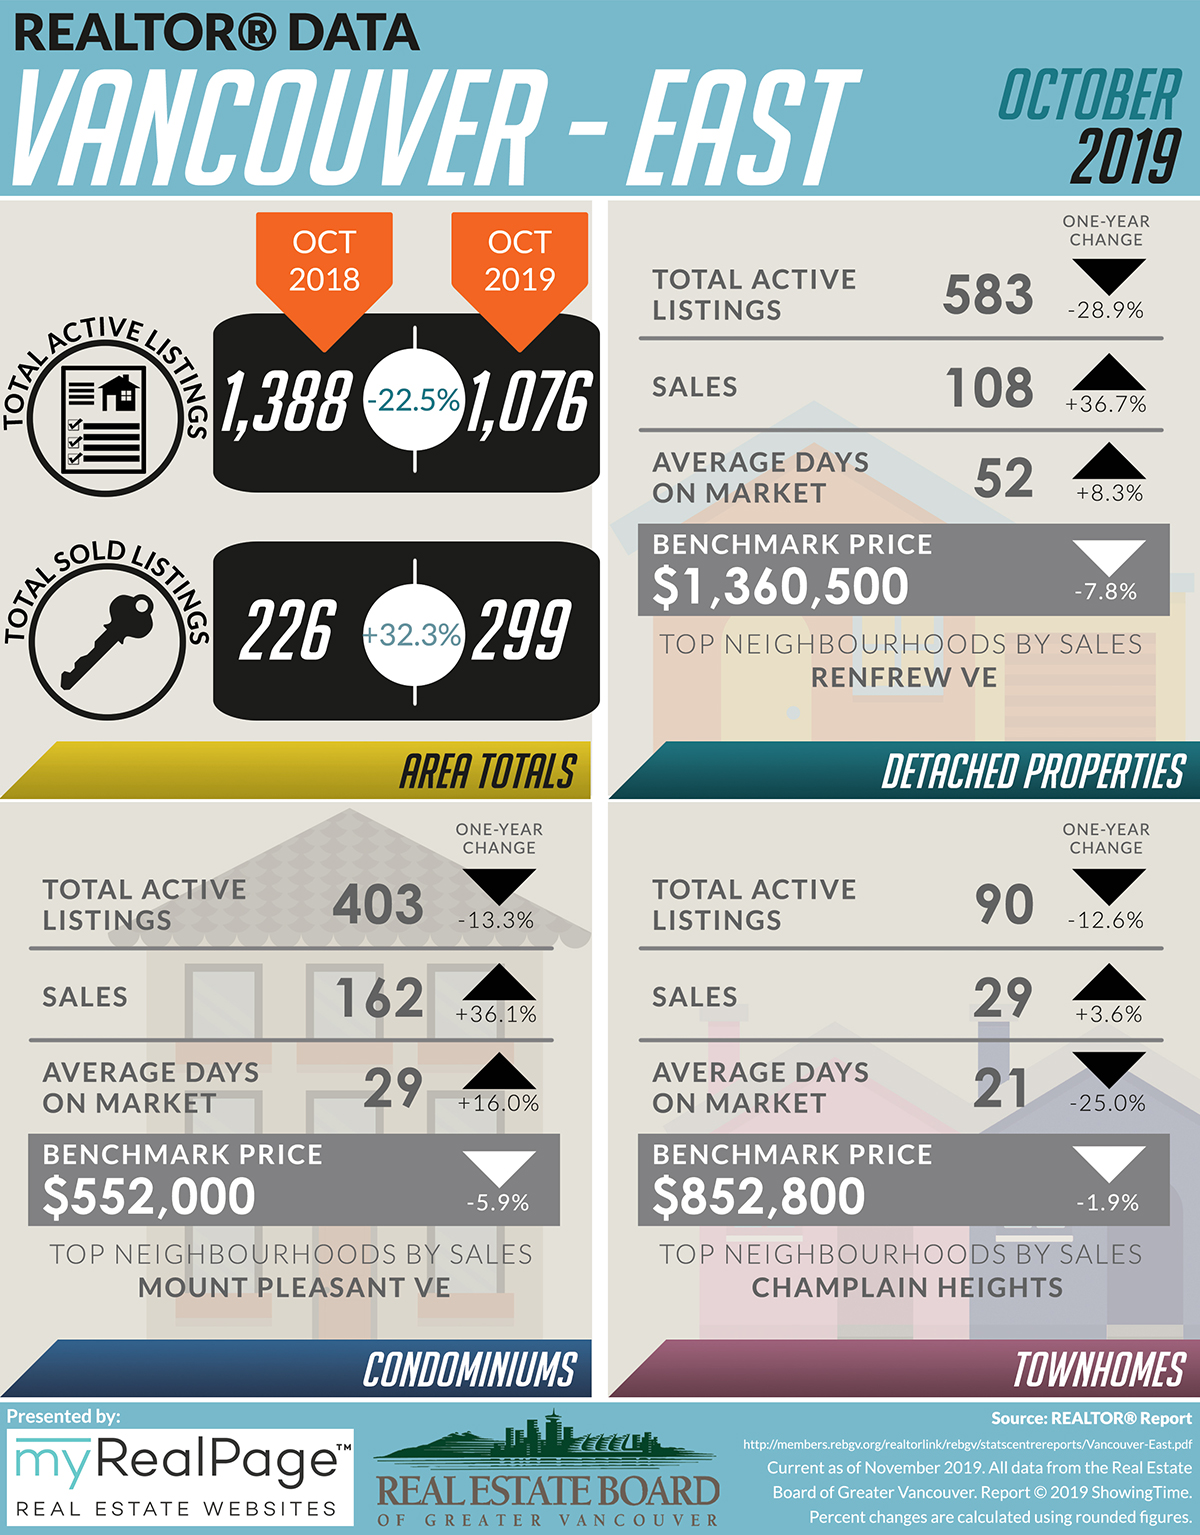
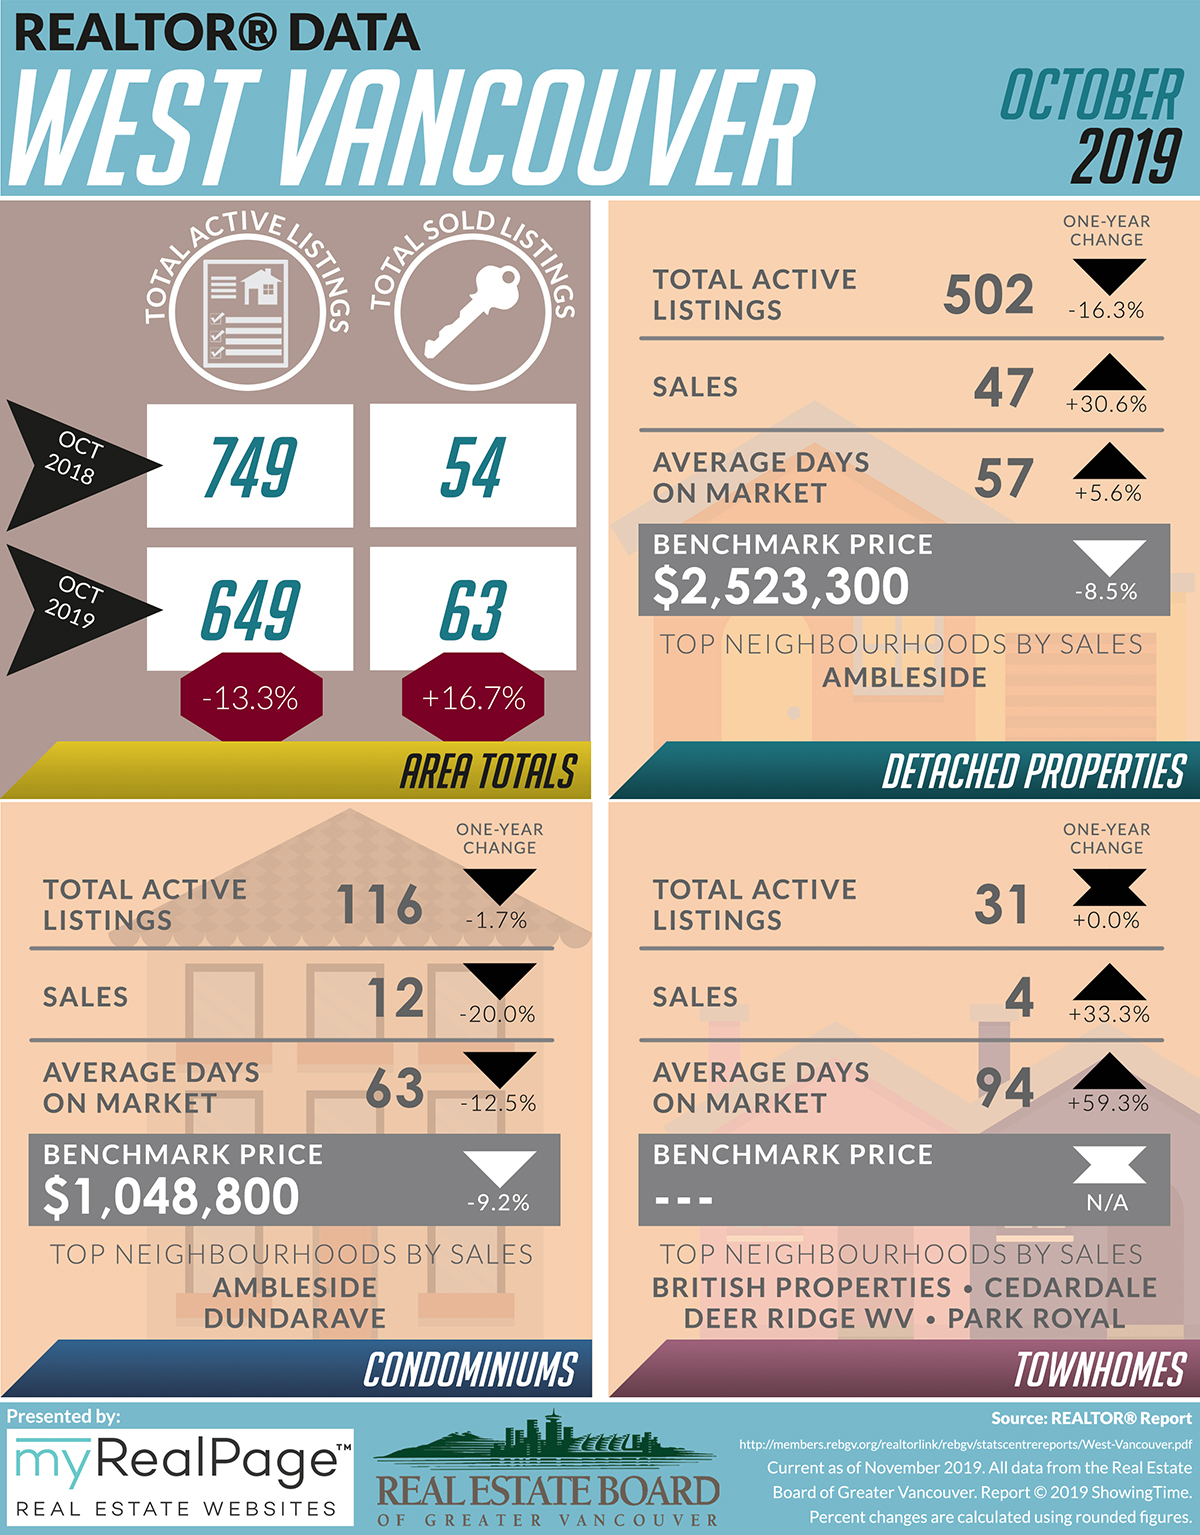
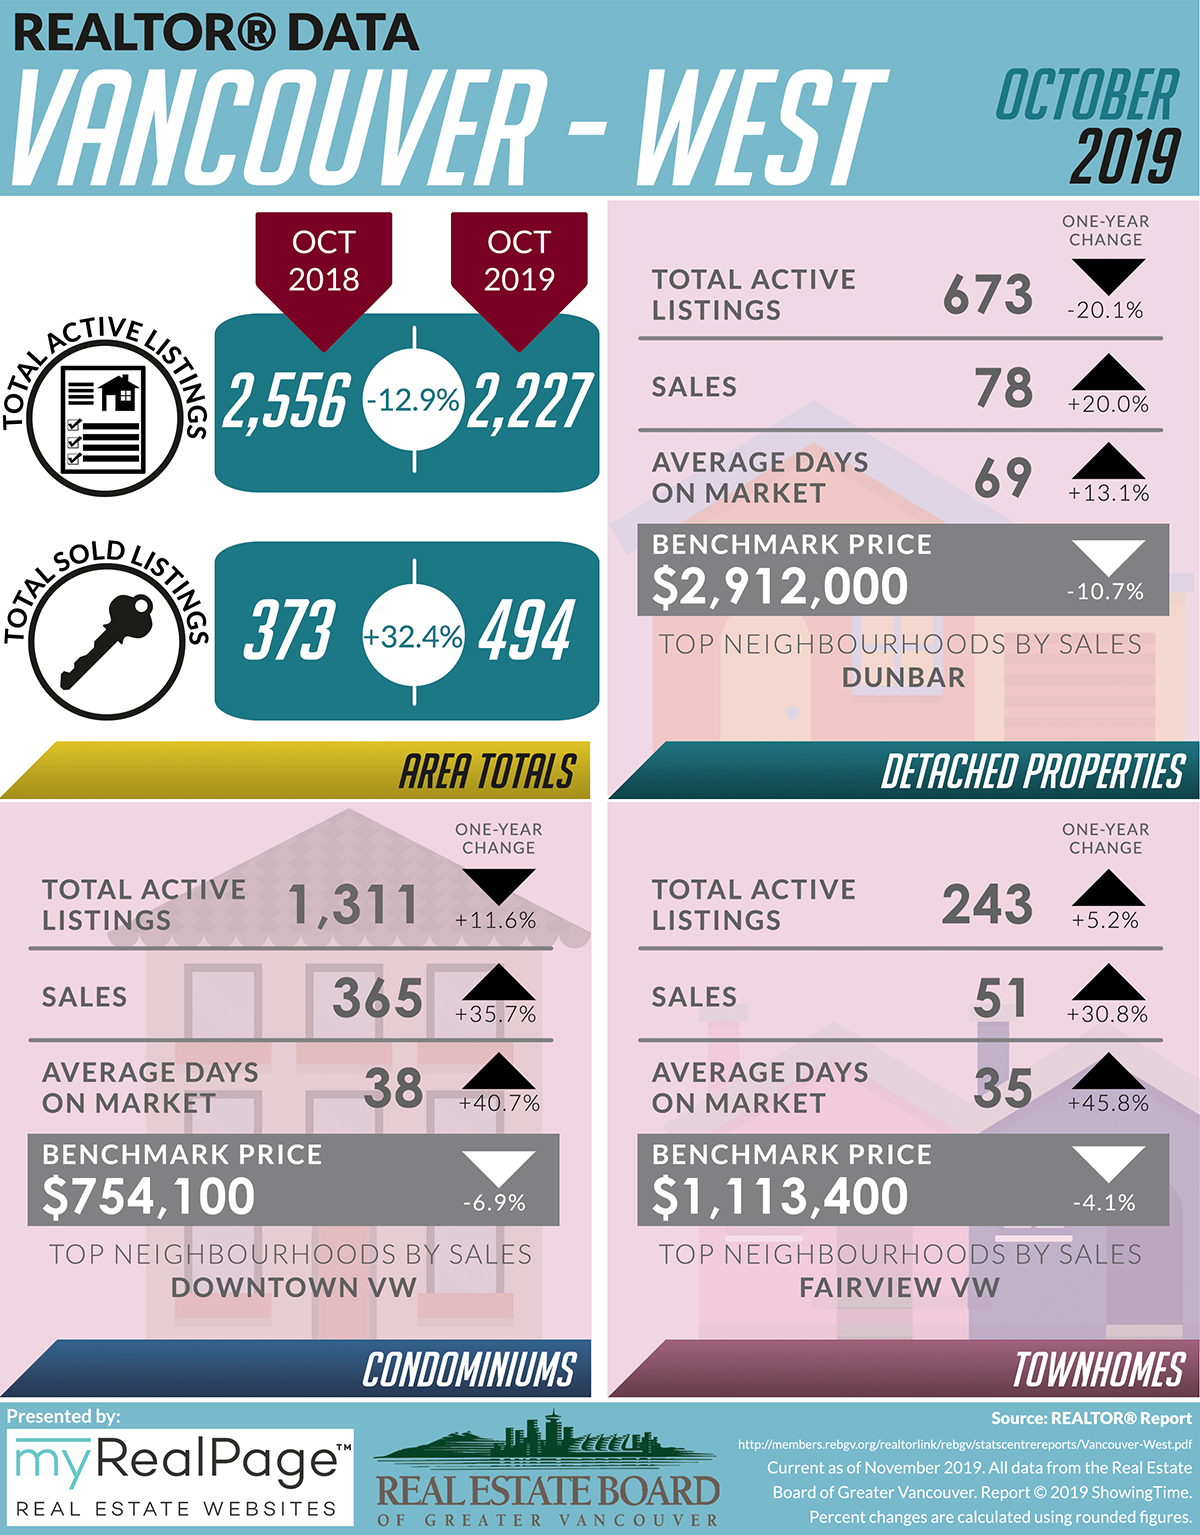
The following data is a comparison between October 2018 and October 2019 numbers, and is current as of November 2019. For last month’s update, you can check out our previous post for September 2019 data.
Or follow this link for all our REBGV Infographics!
These infographics cover current trends in North Vancouver, West Vancouver, Vancouver East, and Vancouver West.
Click on the images for a larger view!
(Protip: Make sure to grab the printable PDF versions, too! It fits best when printed on A4-sized sheets, AND we’ve added an area on the sheet where you can attach your business card! 🙂 )
Download Printable Version – REBGV October 2019 Data Infographics
(Image from REBGV.org)
(Image from REBGV Twitter)
Last Updated on July 25, 2022 by myRealPage
