INFOGRAPHICS: October 2022 TRREB Toronto Market Reports

New GTA Listings Down While the Average Selling Price Levels off in October
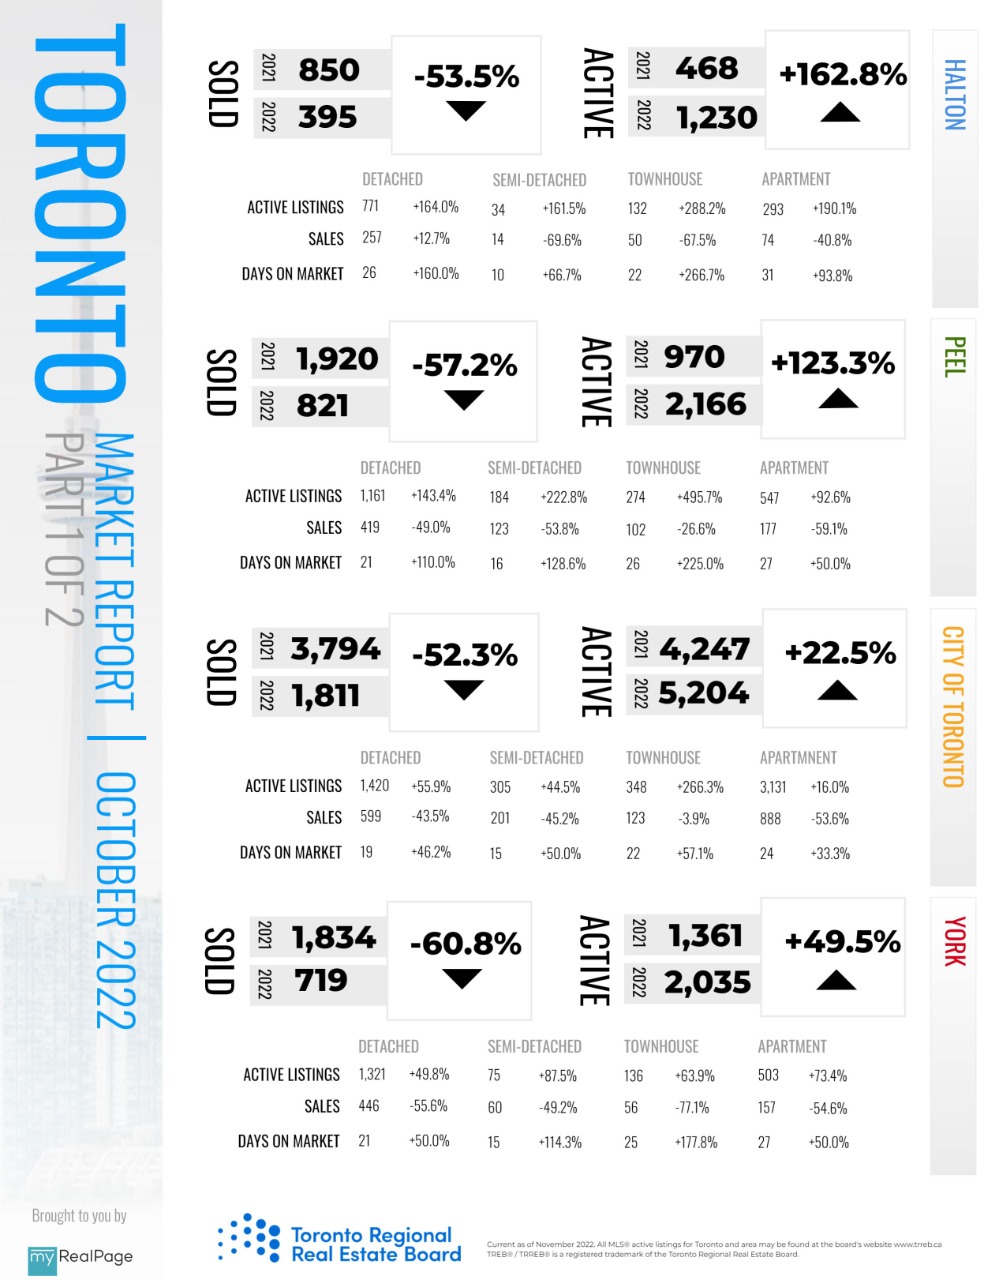
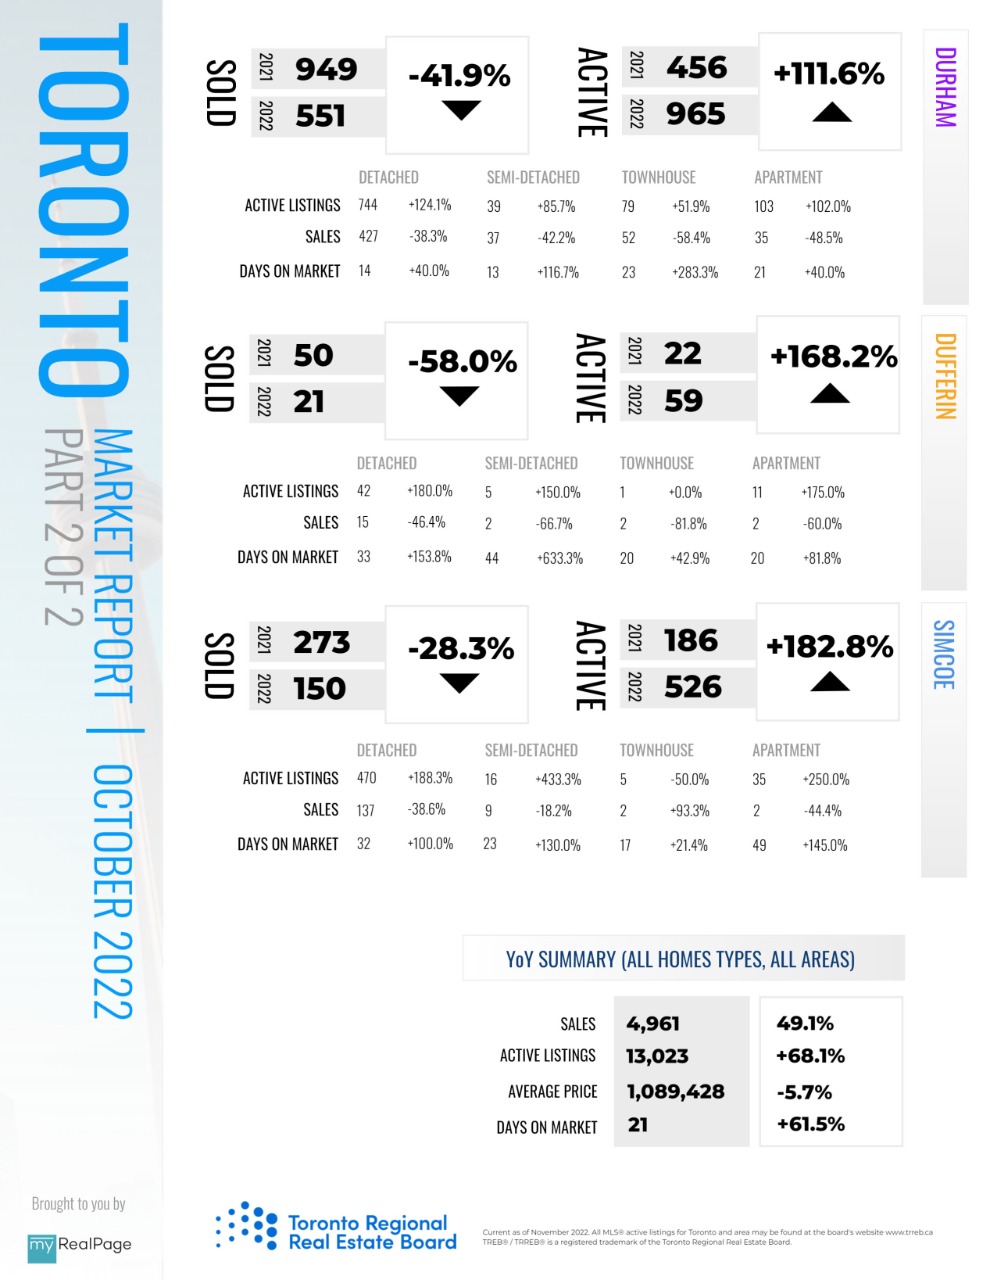
Despite the continued housing market transition to a higher borrowing cost environment, the average selling price in the Greater Toronto Area (GTA) found some support near $1.1 million since the late summer. GTA home sales continued to adjust to substantially higher interest rates in October 2022, both on an annual and monthly basis. However, new listings are also down year-over-year and month-over-month. The persistent lack of inventory helps explain why the downward trend in home prices experienced in the spring has flattened over the past three months.
Read the full report on TRREB website!
The following data is a comparison between October 2022 and October 2021 numbers, and is current as of November 2022. For last month’s numbers, check out our previous infographic!
Or follow this link for all our TREB / TRREB Infographics!
Download Printable Version – October 2022 TRREB, Toronto Market Report Part 1
Download Printable Version – October 2022 TRREB, Toronto Market Report Part 2
Last Updated on November 28, 2023 by myRealPage
