INFOGRAPHICS: September 2020 CREB City And Region Market Reports
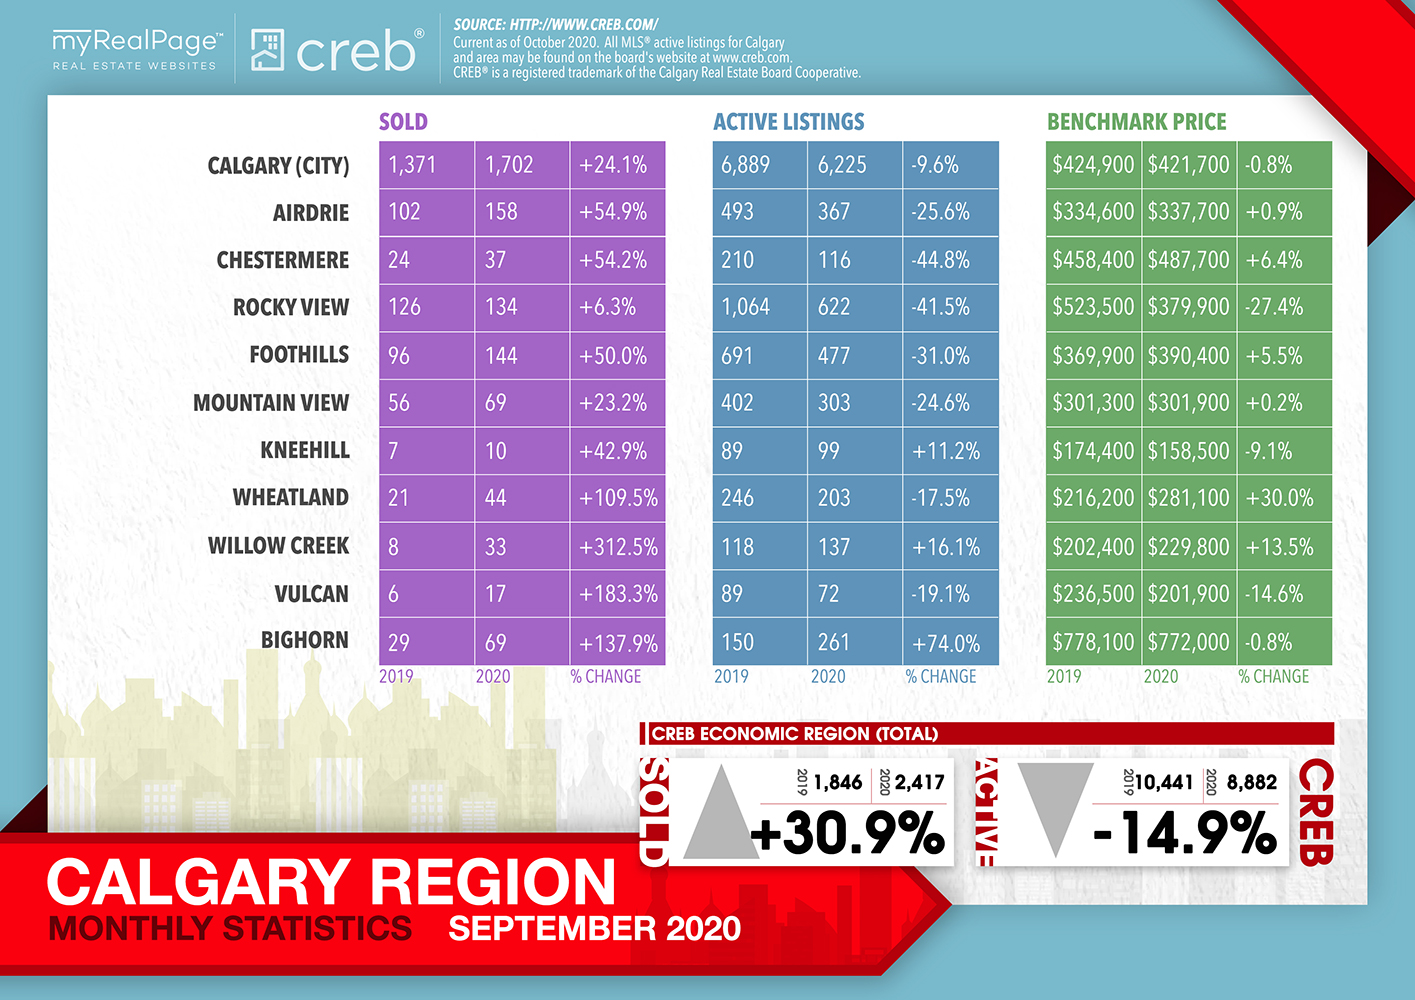
September sales activity jumped to 1,702 units, the strongest September total since 2014.
New listings in September improved over last month, but levels remained comparable to the previous year. The increase in sales relative to new listings did prevent any monthly gains in inventory levels, but supply in the market is still down 12 per cent compared to last year.
Read the full report on the CREB website!
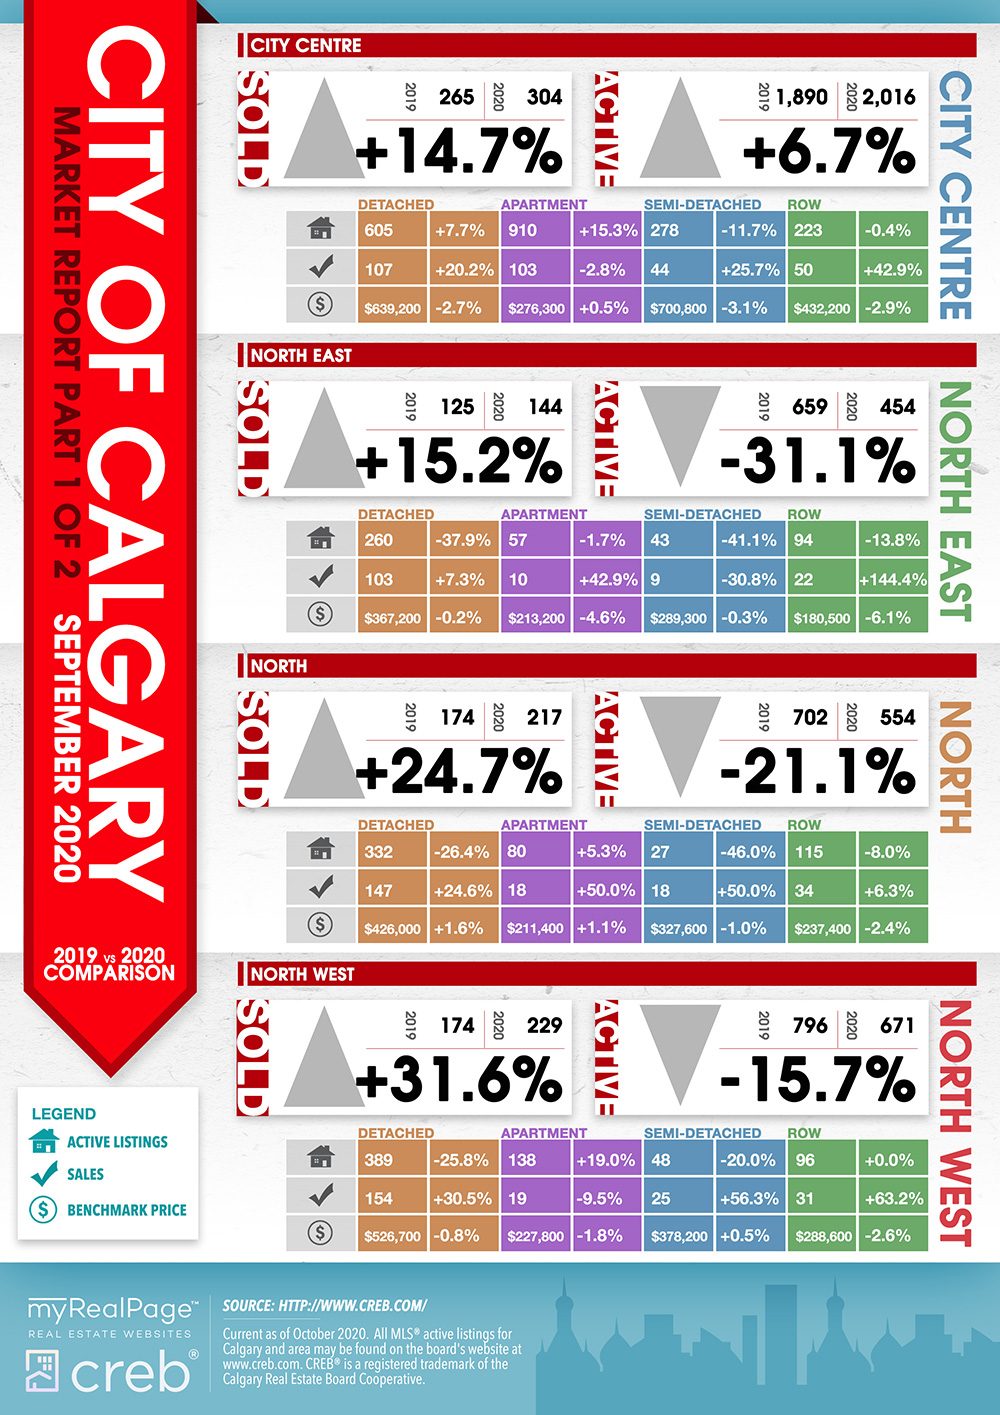
The following data is a comparison between September 2019 and September 2020 numbers, and is current as of October 2020. For last month’s numbers, check out our previous infographic.
Or follow this link for all our CREB Infographics!
Click on the images for a larger view! (Protip: Make sure to grab the printable PDF versions, too! It fits best when printed on A4-sized sheets, AND we’ve added an area on the sheet where you can attach your business card! 🙂 )
Download Printable Version – September 2020 CREB, City of Calgary Report
Download Printable Version – September 2020 CREB, Calgary Region Report

Last Updated on July 25, 2022 by myRealPage
