INFOGRAPHICS: August 2020 CREB City And Region Market Reports
August 2020: home sales consistent, but COVID-19 impacts continue
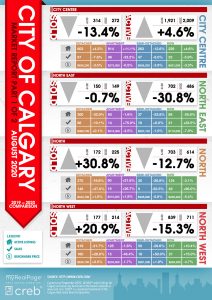
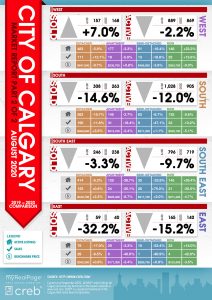
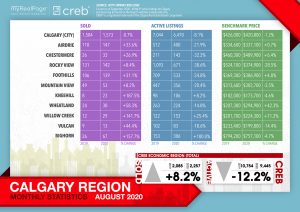
Total residential sales in August were relatively stable compared to last year with year-over-year gains in the detached and row sectors.
These gains offset declines in the apartment and semi-detached sectors.
The 1,573 sales recorded in August are consistent with levels over the past five years. Year-to-date sales activity remains nearly 13 per cent below last year.
Read the full report on the CREB website!
The following data is a comparison between August 2019 and August 2020 numbers, and is current as of September 2020. For last month’s numbers, check out our previous infographic.
Or follow this link for all our CREB Infographics!
Click on the images for a larger view! (Protip: Make sure to grab the printable PDF versions, too! It fits best when printed on A4-sized sheets, AND we’ve added an area on the sheet where you can attach your business card! 🙂 )
Download Printable Version – August 2020 CREB, City of Calgary Report
Download Printable Version – August 2020 CREB, Calgary Region Report
Last Updated on November 28, 2023 by myRealPage
