INFOGRAPHICS: July 2020 CREB City And Region Market Reports

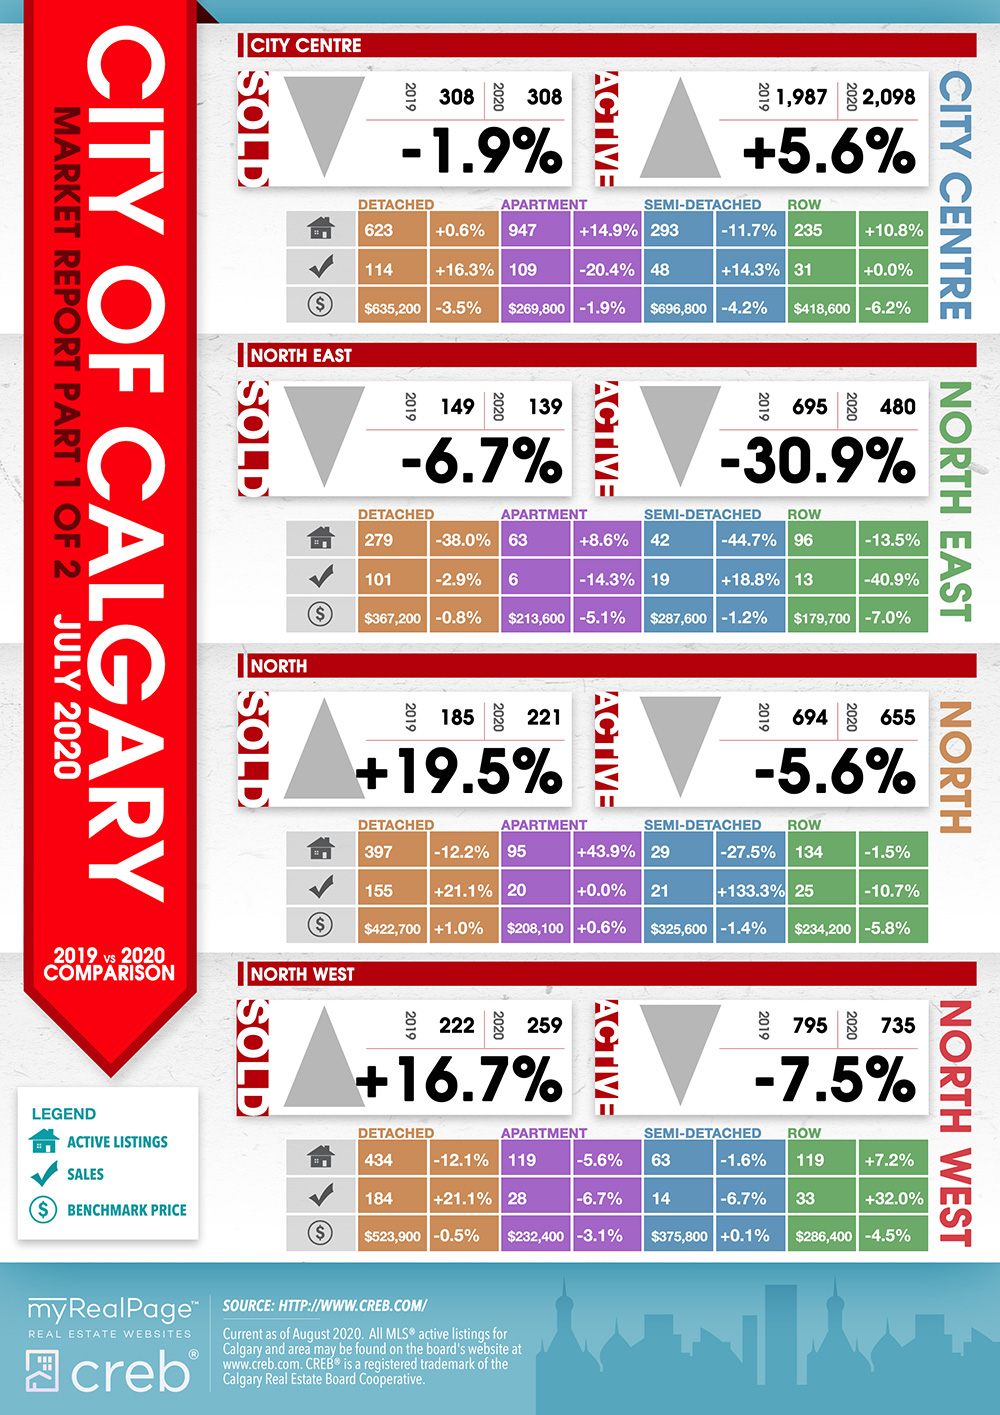
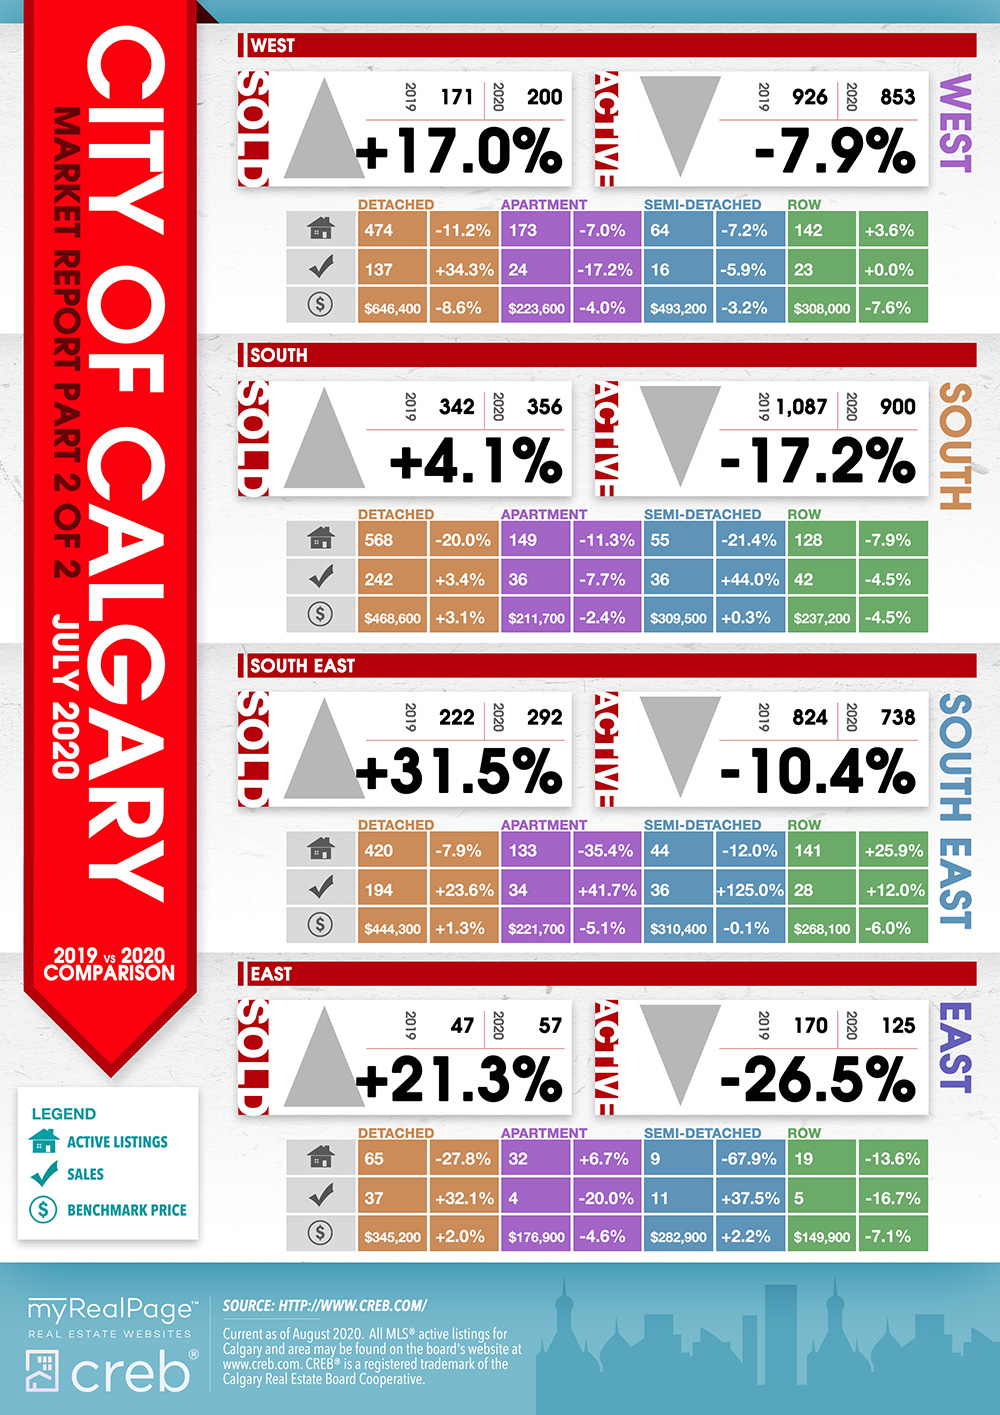
July 2020: Detached and semi-detached home sales rise, but economic uncertainty remains
With higher sales for both detached and semi-detached product, July sales totals rose above last year’s levels. Despite the improvements in July, year-to-date sales remain 15% lower than last year’s levels.
COVID-19 shutdowns occurred over the traditionally busiest quarter for real estate sales. Some of the recent gains reflect activity that would have occurred in those months shifting into July. Some demand is returning to the market, but so is the supply.
Inventory levels trended up over the previous month, offsetting some of the sales growth. Higher-density row and apartment products have supply/demand ratios that are well above traditional levels.
Read the full report on the CREB website!
The following data is a comparison between July 2019 and July 2020 numbers, and is current as of August 2020. For last month’s numbers, check out our previous infographic.
Or follow this link for all our CREB Infographics!
Click on the images for a larger view! (Protip: Make sure to grab the printable PDF versions, too! It fits best when printed on A4-sized sheets, AND we’ve added an area on the sheet where you can attach your business card! 🙂 )
Download Printable Version – July 2020 CREB, City of Calgary Report
Download Printable Version – July 2020 CREB, Calgary Region Report

Last Updated on July 25, 2022 by myRealPage
