INFOGRAPHICS: September 2021 CREB City And Region Market Reports
Sales remain strong
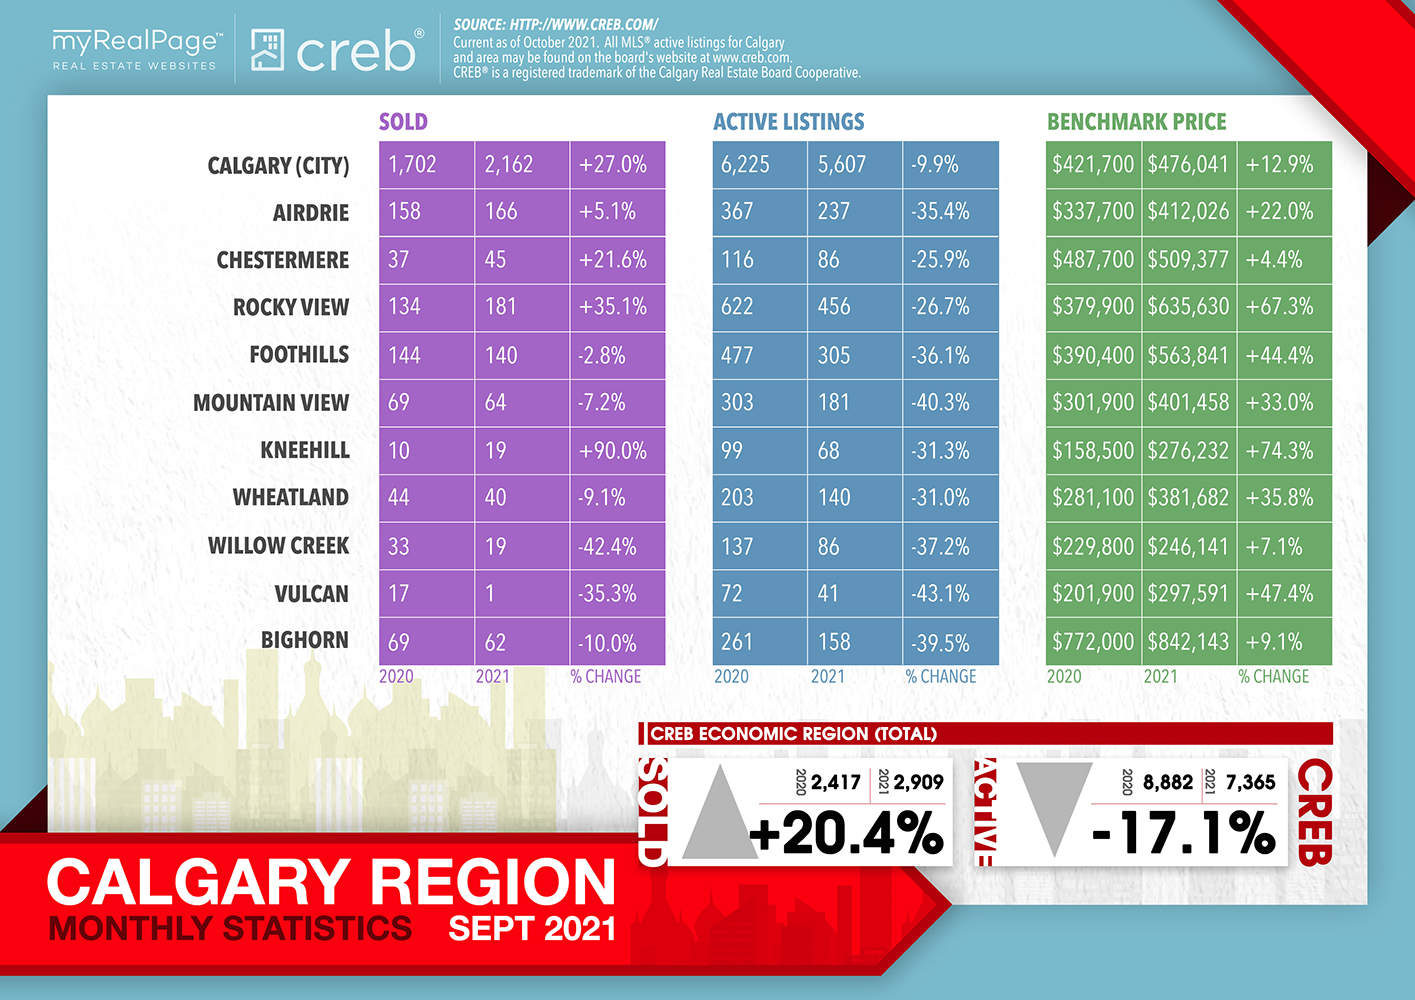
Residential sales totalled 2,162 in September, nearing the record high for the month recorded in 2005. Further gains in new listings likely supported some of the sales growth that occurred this month.
“While sales activity in the fall tends to be slower than in the spring months, the continued strong sales are likely being driven by consumers who were unable to transact earlier in the year when supply levels had not yet adjusted to demand,” said CREB® chief economist Ann-Marie Lurie. “The market continues to favour the seller, but conditions are not as tight as they were earlier this year.”
Read the full report on the CREB website!
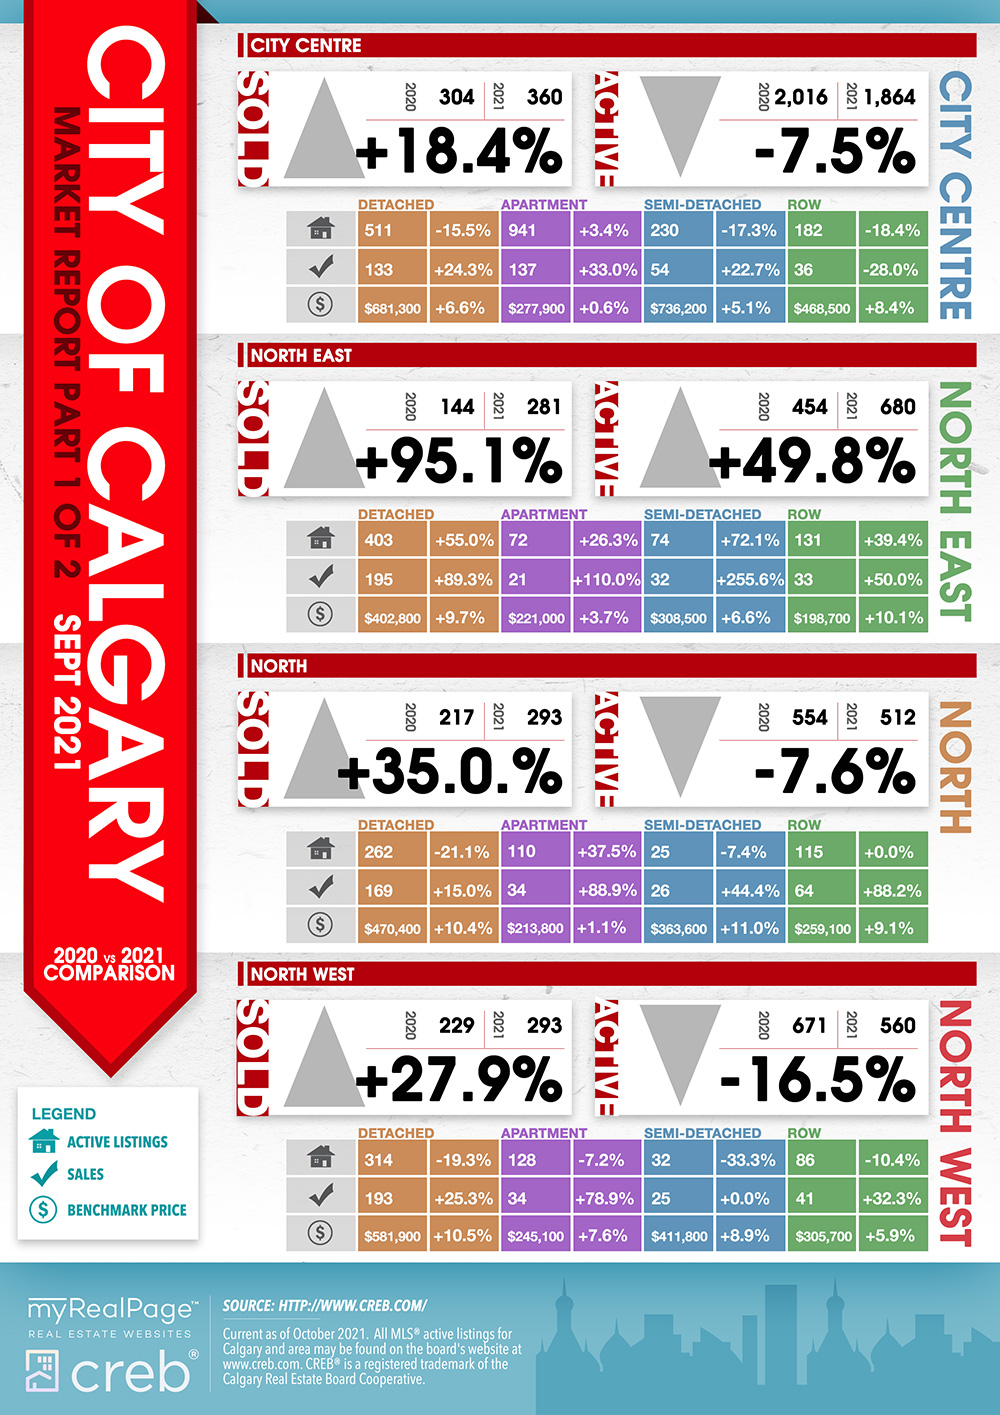
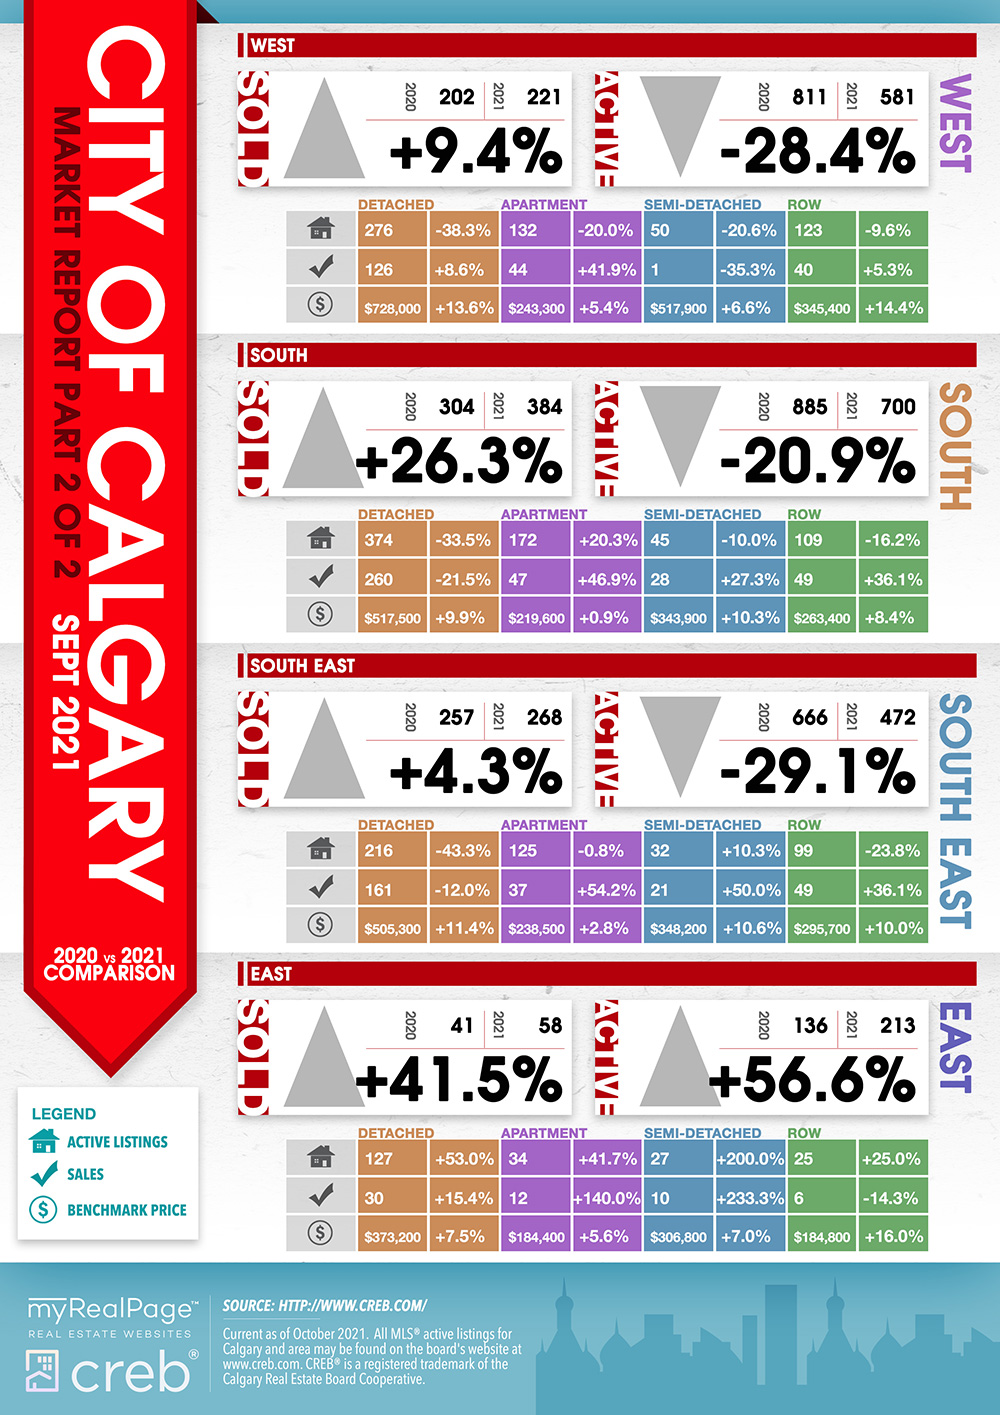
The following data is a comparison between September 2020 and September 2021 numbers, and is current as of October 2021. For last month’s numbers, check out our previous infographic.
Or follow this link for all our CREB Infographics!
Click on the images for a larger view! (Protip: Make sure to grab the printable PDF versions, too! It fits best when printed on A4-sized sheets, AND we’ve added an area on the sheet where you can attach your business card! 🙂 )
Download Printable Version – September 2021 CREB, City of Calgary Report
Download Printable Version – September 2021 CREB, Calgary Region Report
Last Updated on July 25, 2022 by myRealPage
