INFOGRAPHICS: September 2021 TRREB Toronto Market Reports
Tight GTA Housing Market Conditions Sustain Strong Price Growth
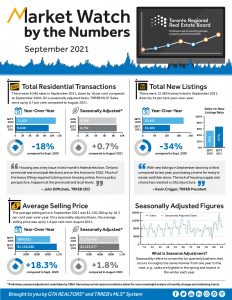
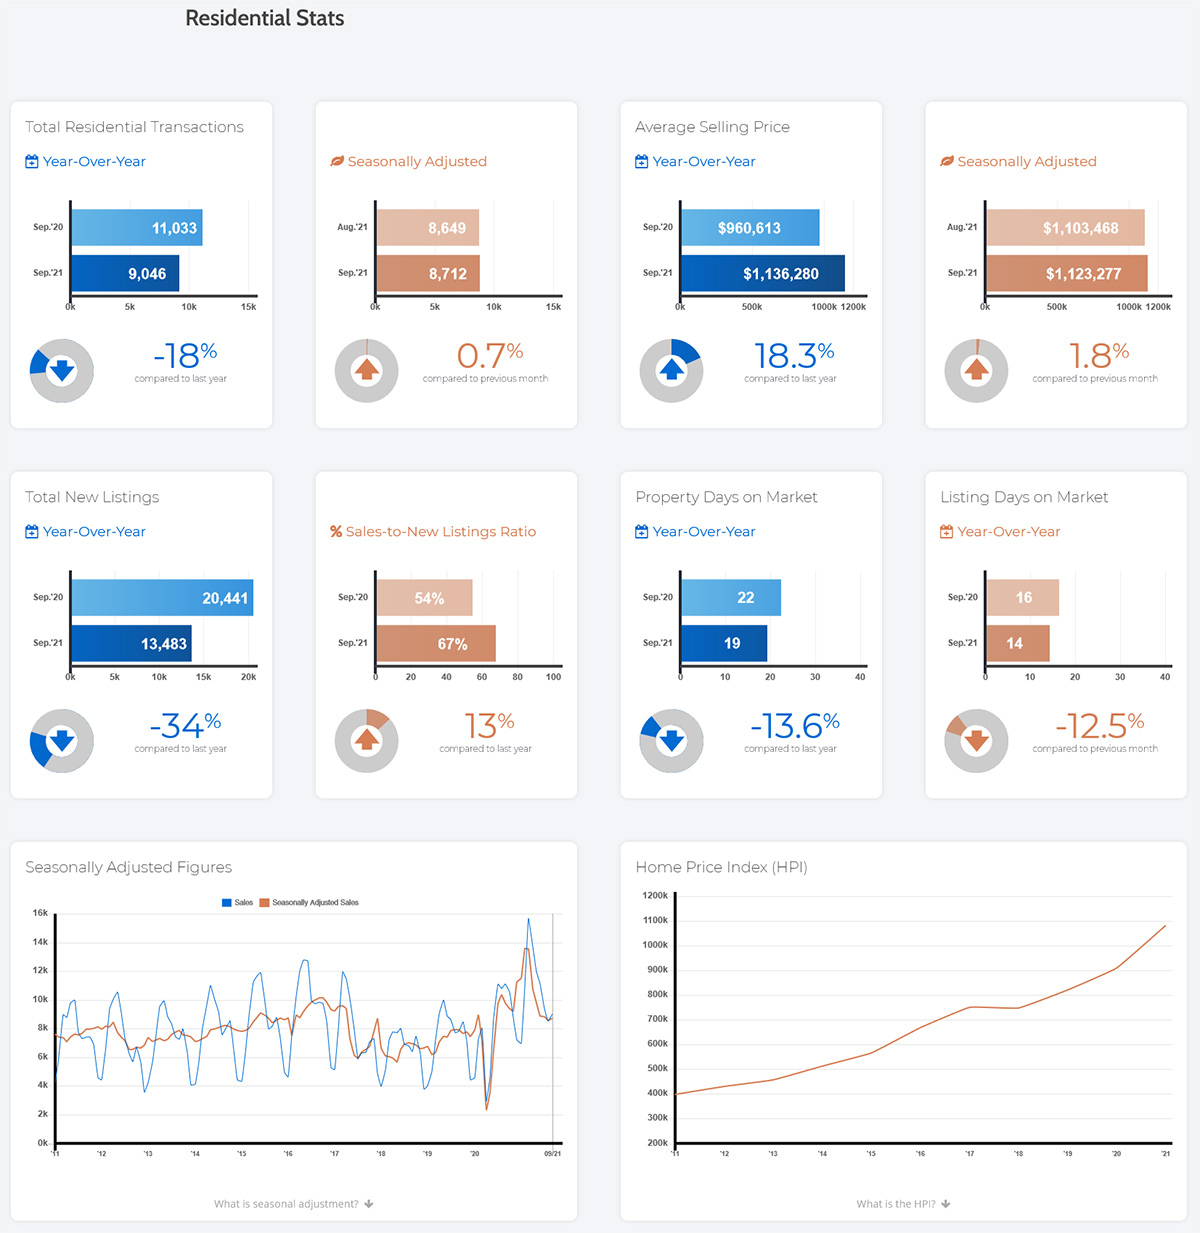
September marked the transition from the slower summer market to the busier fall market in the Greater Toronto Area (GTA). Every year, we generally see an uptick in sales, average selling price and listings after Labour Day, and September 2021 was no different. Sales increased relative to August and were also at the third-highest mark on record for the month of September. The average selling price was up both month-over-month and year-over-year.
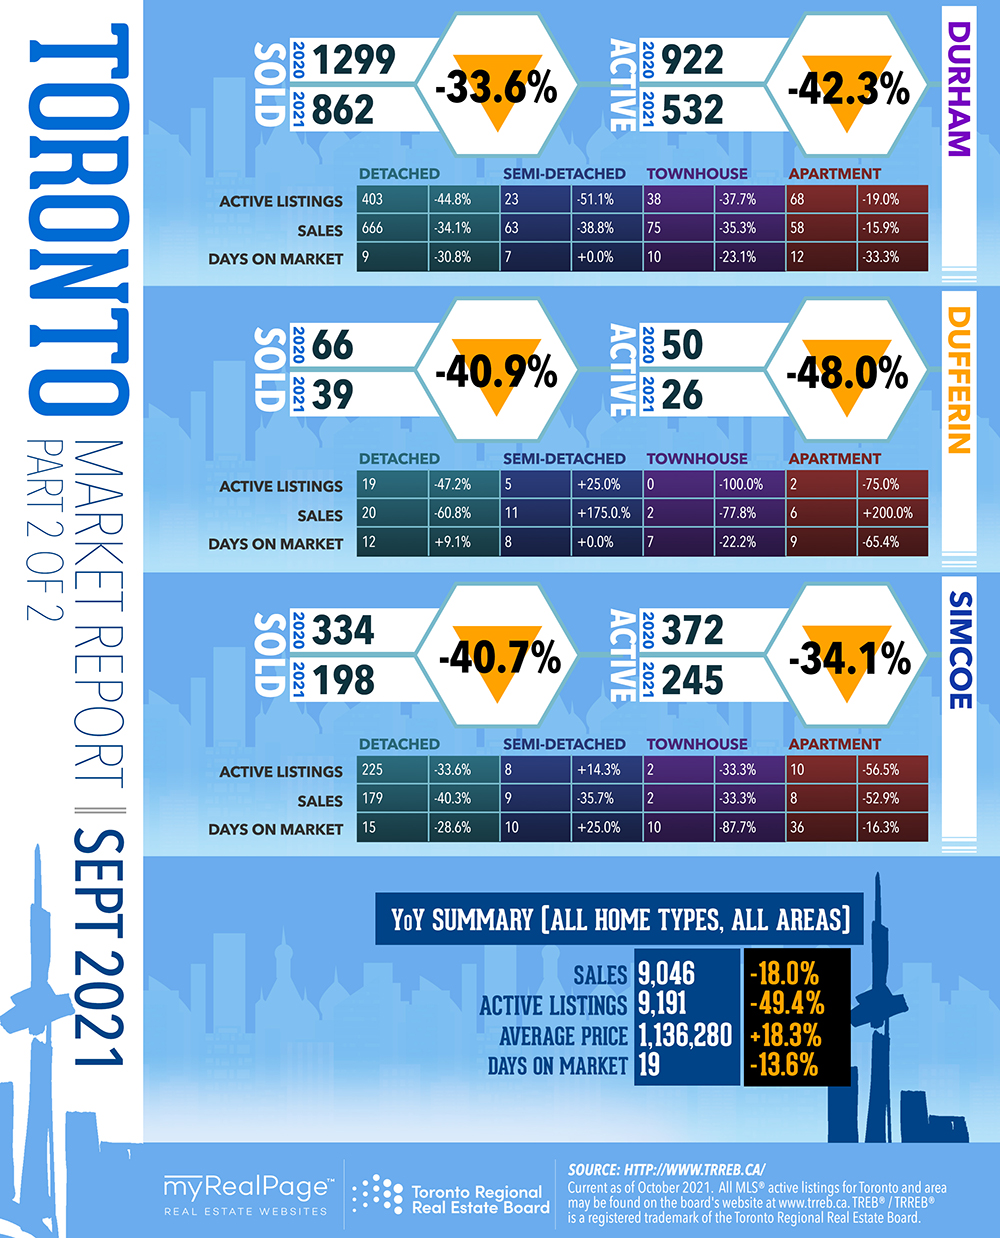
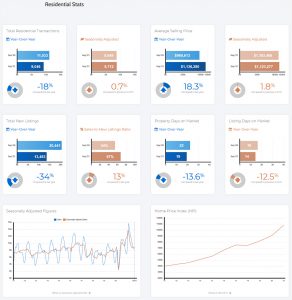
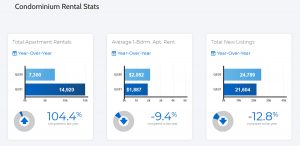
GTA REALTORS® reported 9,046 sales through TRREB’s MLS® System in September 2021 – up in line with the regular seasonal trend from August. Compared to last year, market conditions tightened noticeably, with sales representing a substantially higher share of listings, and a significantly lower number of new listings across the board. Resurgence in the condo market was a factor in the higher share of listings sold. The total number of sales was down 18% from 2020’s record September result, in large part due to the lower number of new listings, which were down 34% from the same time last year.
Read the full report on TRREB website!
The following data is a comparison between September 2020 and September 2021 numbers, and is current as of October 2021. For last month’s numbers, check out our previous infographic!
Or follow this link for all our TREB / TRREB Infographics!
Click on the images for a larger view! (Protip: Make sure to grab the printable PDF versions, too! It fits best when printed on A4-sized sheets, AND we’ve added an area on the sheet where you can attach your business card! 🙂 )
Download Printable Version – September 2021 TRREB, Toronto Market Report

-
- (from TRREB website)

-
- (from TRREB website)
-
- (from TRREB website)
-
- (from TRREB website)

-
- (from TRREB website)

-

- (from TRREB Twitter)

-

- (from TRREB Twitter)

Last Updated on July 25, 2022 by myRealPage
