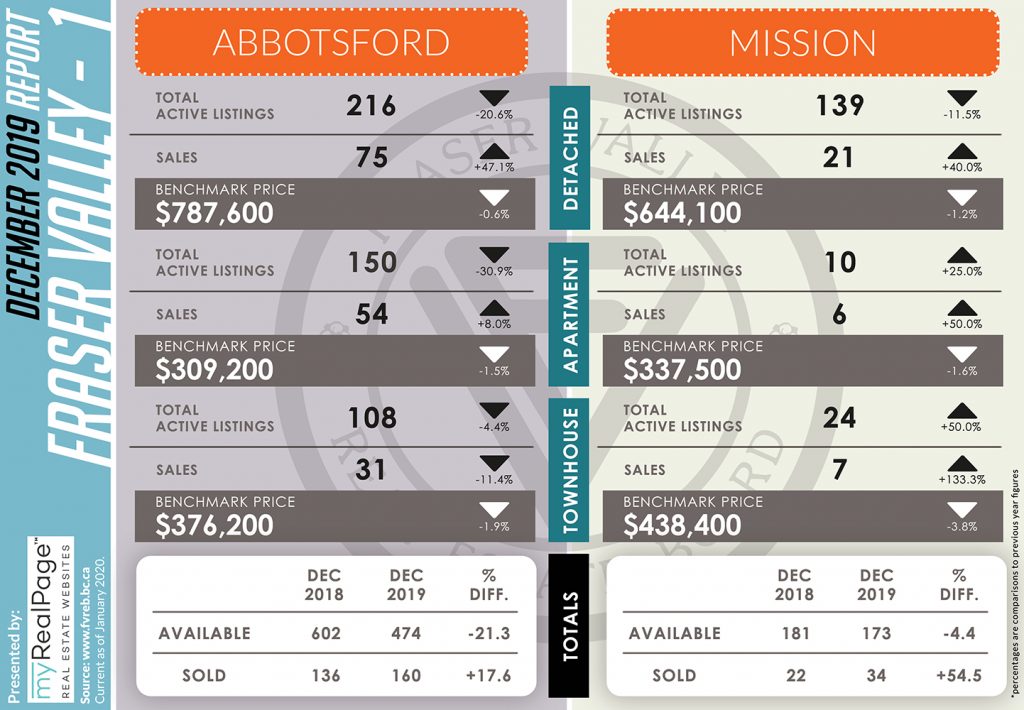
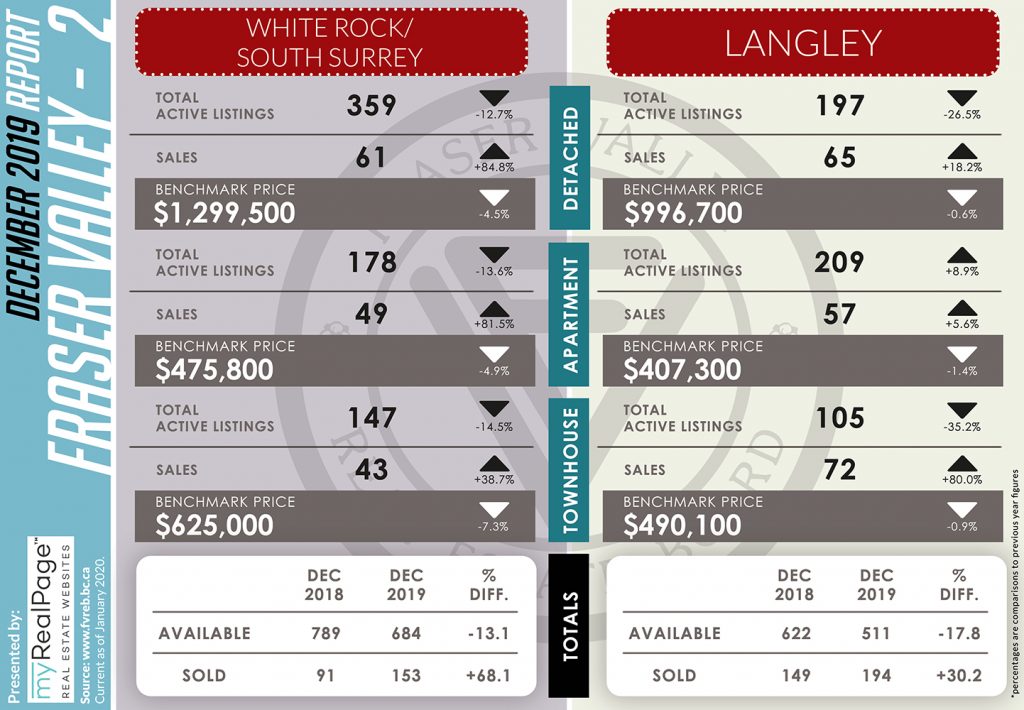
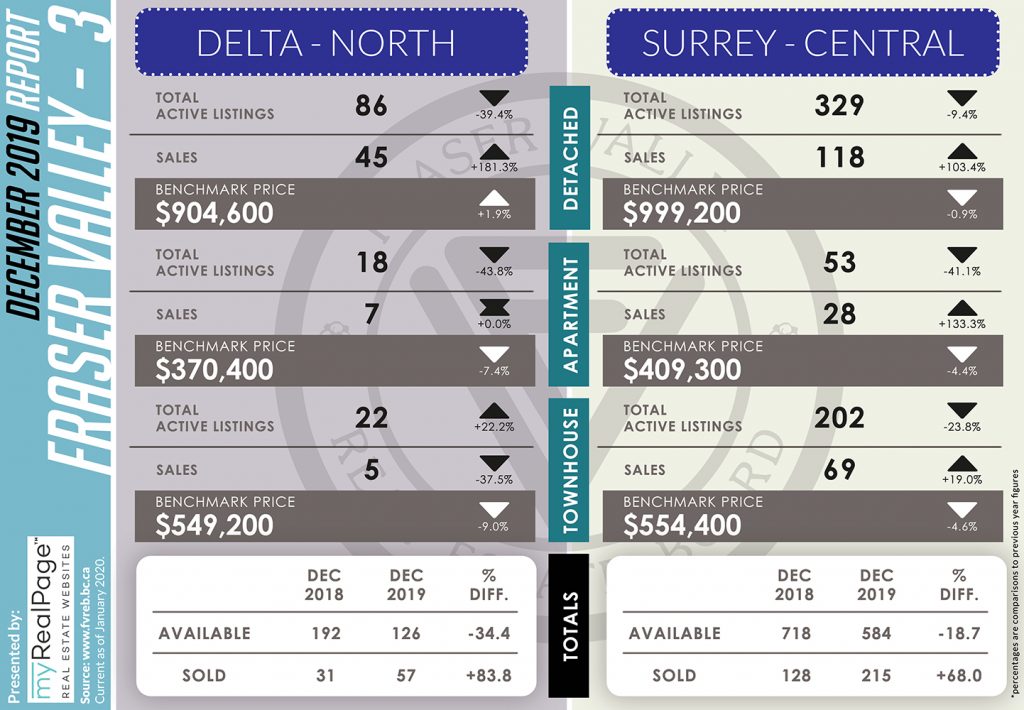
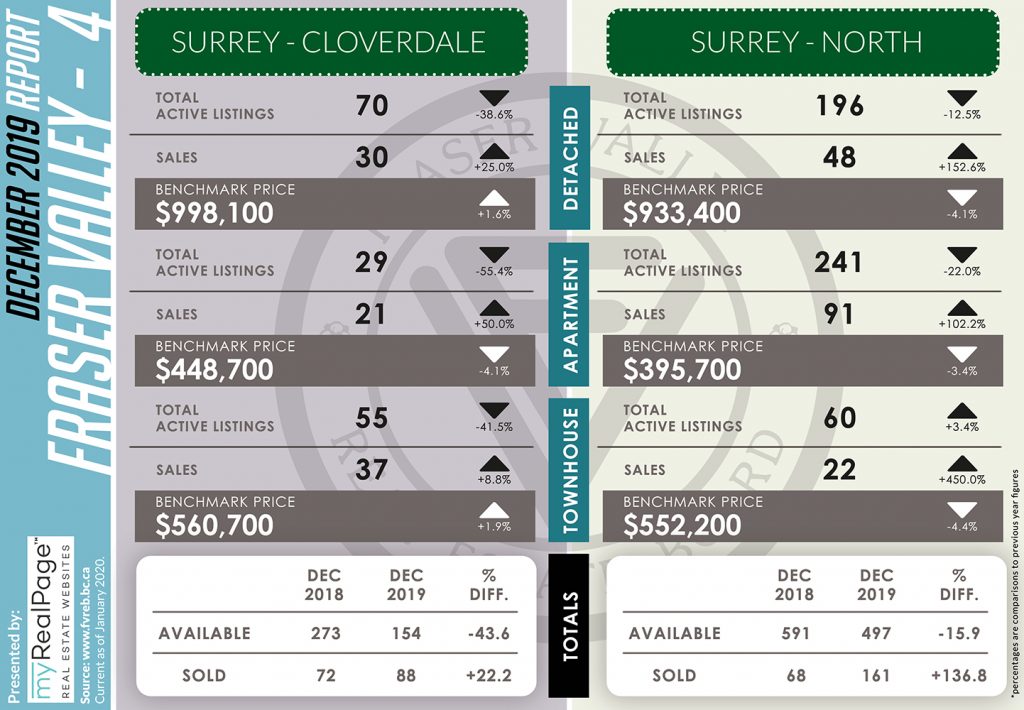
INFOGRAPHICS: December 2019 FVREB Fraser Valley, South Surrey, Etc. Market Reports
Starting strong in 2020! Here are this month’s market updates for the Fraser Valley Real Estate Board (FVREB)!
As noted in FVREB’s most recent market update, we’re seeing a strong finish for mediocre year in Fraser Valley real estate.
After a sluggish first half of the year, property sales in the Fraser Valley started picking up speed in the summer and finished strong in December, but not enough to surpass last year’s sales totals.
The Board’s Multiple Listing Service® (MLS®) processed 15,487 sales in 2019, a 0.6% decrease compared to 2018’s 15,586 sales and the lowest total sales volume for the Fraser Valley since 2013. The total dollar volume of MLS® transactions for the year was $11.2 billion, dropping from $11.8 billion sold during the year prior.
In 2019, total sales of the three main residential property types – detached, townhome and apartment – was 13,773. Of that total, 5,770 were detached, 3,888 were townhouses and 4,115 were apartments. Year-over-year, sales of detached and townhomes increased by 0.6% compared to 2018, while apartment sales dropped by 4.2%.
In December the Board processed a total of 1,247 sales, the third best December since 2010. Active inventory finished at 4,686 units in December, 20.3% lower than the 10-year average for the month, with a total of 948 new listings entering the market throughout the month.
A total of 30,568 new listings were received by the Board’s MLS® system in 2019. This year was the second lowest for new inventory for the Board in the last decade.
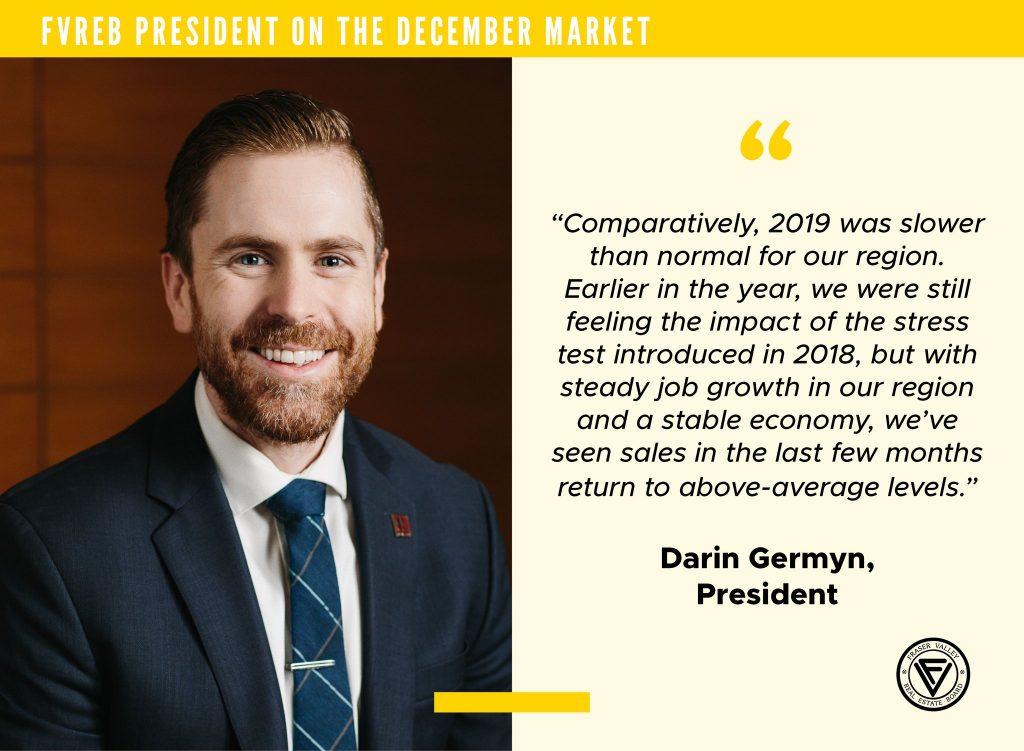
As noted by Darin Germyn, President of the Board,
“Comparatively, 2019 was slower than normal for our region. Earlier in the year, we were still feeling the impact of the stress test introduced in 2018, but with steady job growth in our region and a stable economy, we’ve seen sales in the last few months return to above-average levels.
Some sellers have been holding back on listing, waiting until the market improves, with the result that supply in many areas currently is quite tight; so if you’re looking to enter the market in 2020, now is a good time. Without a healthy supply of inventory in the coming months, we could see upward pressure on prices.”
The following data is a comparison between December 2018 and December 2019 numbers, and is current as of January 2020. For last month’s report, check out our previous infographic!
Or follow this link for all our FVREB Infographics!
These infographics cover current trends in Fraser Valley neighbourhoods that are within the FVREB.
Click on the images for a larger view!
(Protip: Make sure to grab the printable PDF version, too! It fits best when printed on A4-sized sheets, AND we’ve added an area on the sheet where you can attach your business card! 🙂 )
Download Printable Version – FVREB December 2019 Market Report
(Image Source: FVREB Twitter)
Last Updated on July 25, 2022 by myRealPage


