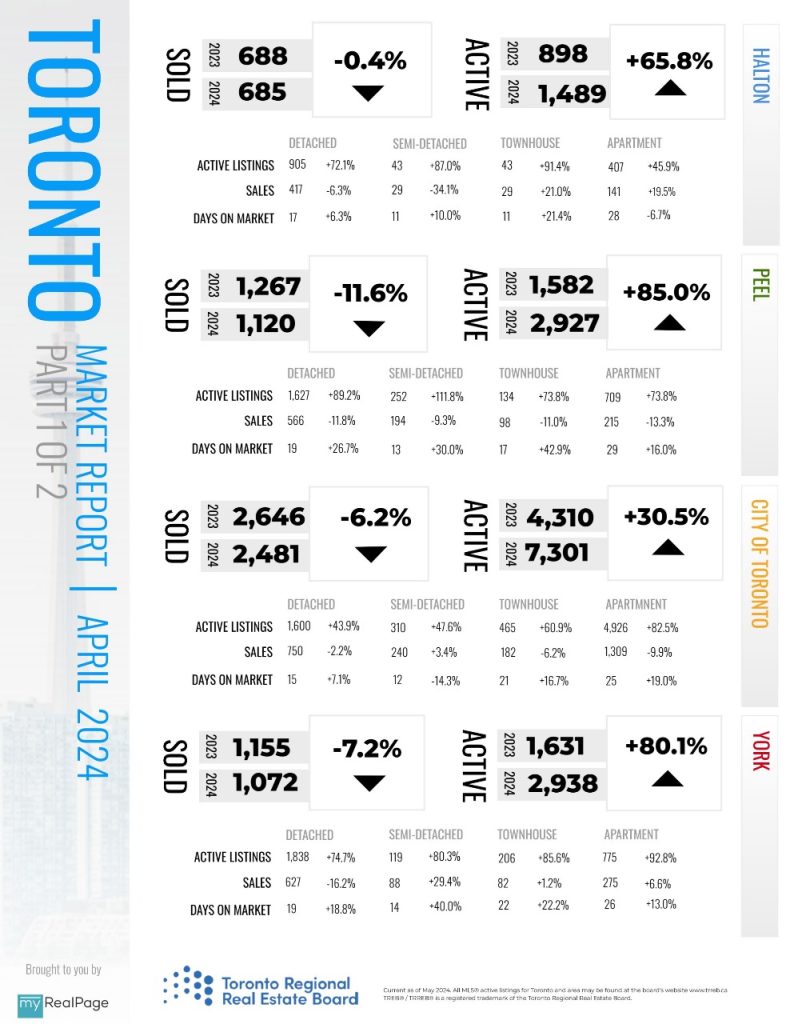
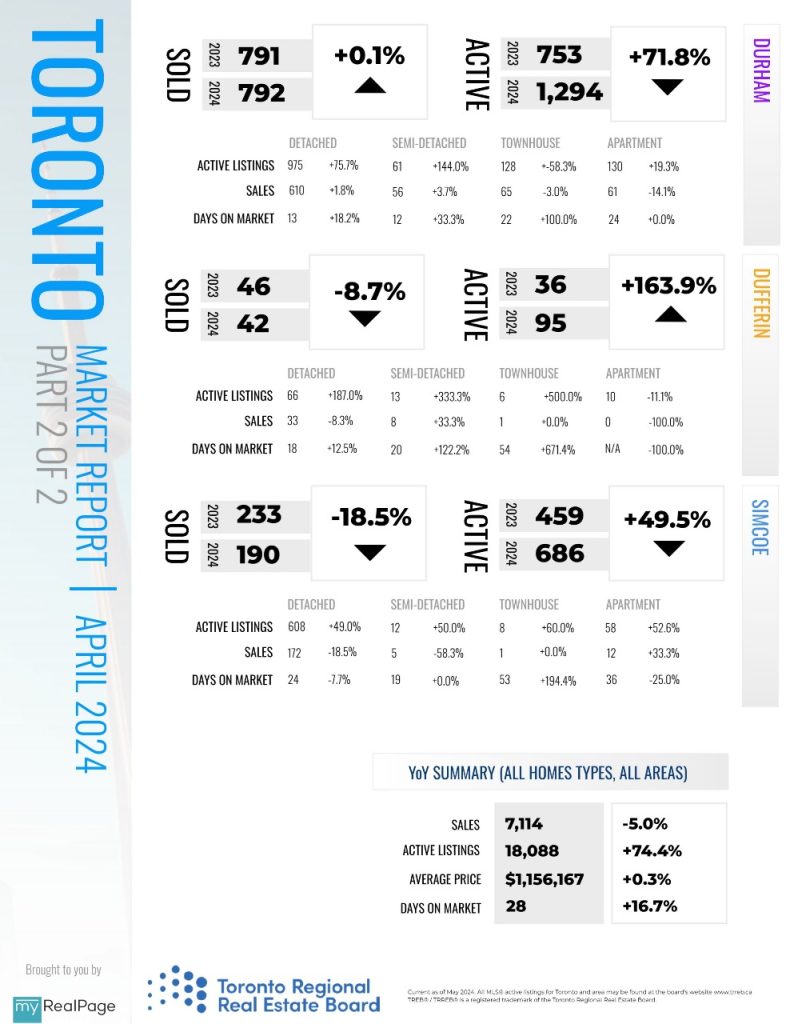
INFOGRAPHICS: April 2024 TRREB Toronto Market Reports

TRREB: More Choice for Home Buyers in April
April 2024 home sales were down in comparison to April 2023, when there was a temporary resurgence in market activity. New listings were up strongly year-over-year, which meant there was increased choice for home buyers and little movement in the average selling price compared to last year.
Greater Toronto Area (GTA) REALTORS® reported 7,114 sales through the Toronto Regional Real Estate Board (TRREB) MLS® System in April 2024 – down by five per cent compared to April 2023. New listings were up by 47.2 per cent over the same period. On a seasonally adjusted monthly basis, sales edged lower while new listings were up compared to March.
“Listings were up markedly in April in comparison to last year and last month. Many homeowners are anticipating an increase in demand for ownership housing as we move through the spring. While sales are expected to pick up, many would-be home buyers are likely waiting for the Bank of Canada to actually begin cutting its policy rate before purchasing a home,” said TRREB President Jennifer Pearce.
Read the full report on TRREB website!
The following data is a comparison between April 2024 and April 2023 numbers, and is current as of May 2024. For last month’s numbers, check out our previous infographic!
Or follow this link for all our TREB / TRREB Infographics!
Download Printable Version – April 2024 TRREB, Toronto Market Report Part 1
Download Printable Version – April 2024 TRREB, Toronto Market Report Part 2
Last Updated on May 8, 2024 by myRealPage


